
Plaid API x dbt
Fintech adoption has surged as the pandemic has presented new financial challenges, such as the closure of physical bank branches, and forced most business online. Plaid, the San Francisco-based fintech, has been uniquely positioned amidst this growth because its services enable users to easily and securely connect their financial accounts to a wide range of leading fintech apps including payment processors (Stripe, Square), investment platforms (Betterment) and credit card companies (Petal).
Plaid allows any user to easily utilize their API to access either their own financial data or sample “sandbox” data that is generated by Plaid. I decided to delve into the past year of sandbox data by extracting it from their API endpoints and exploring key financial information including their assets/liabilities as well as monthly and annual transaction patterns through a Tableau dashboard.

Methodology v1 (without dbt)
I accessed the Plaid API by using the Postman API platform and Plaid’s Postman Collection which is easily accessible through their GitHub. Before beginning, I created an account on the Plaid Dashboard site that allowed me to access my unique API keys which I then copied into the Postman app in order to validate my API requests. I was then able to send requests to the Plaid API and receive responses such as this one retrieving transaction data from September 20th, 2020 until September 20th, 2021. I decided to focus on two specific API product endpoints, Balance and Transactions, because they provided compelling data about both short-term financial patterns such as daily transaction totals and monthly credit card balance as well as longer-term financial health such as year-to-date transaction totals by merchant category along with mortgage and student loan balances.
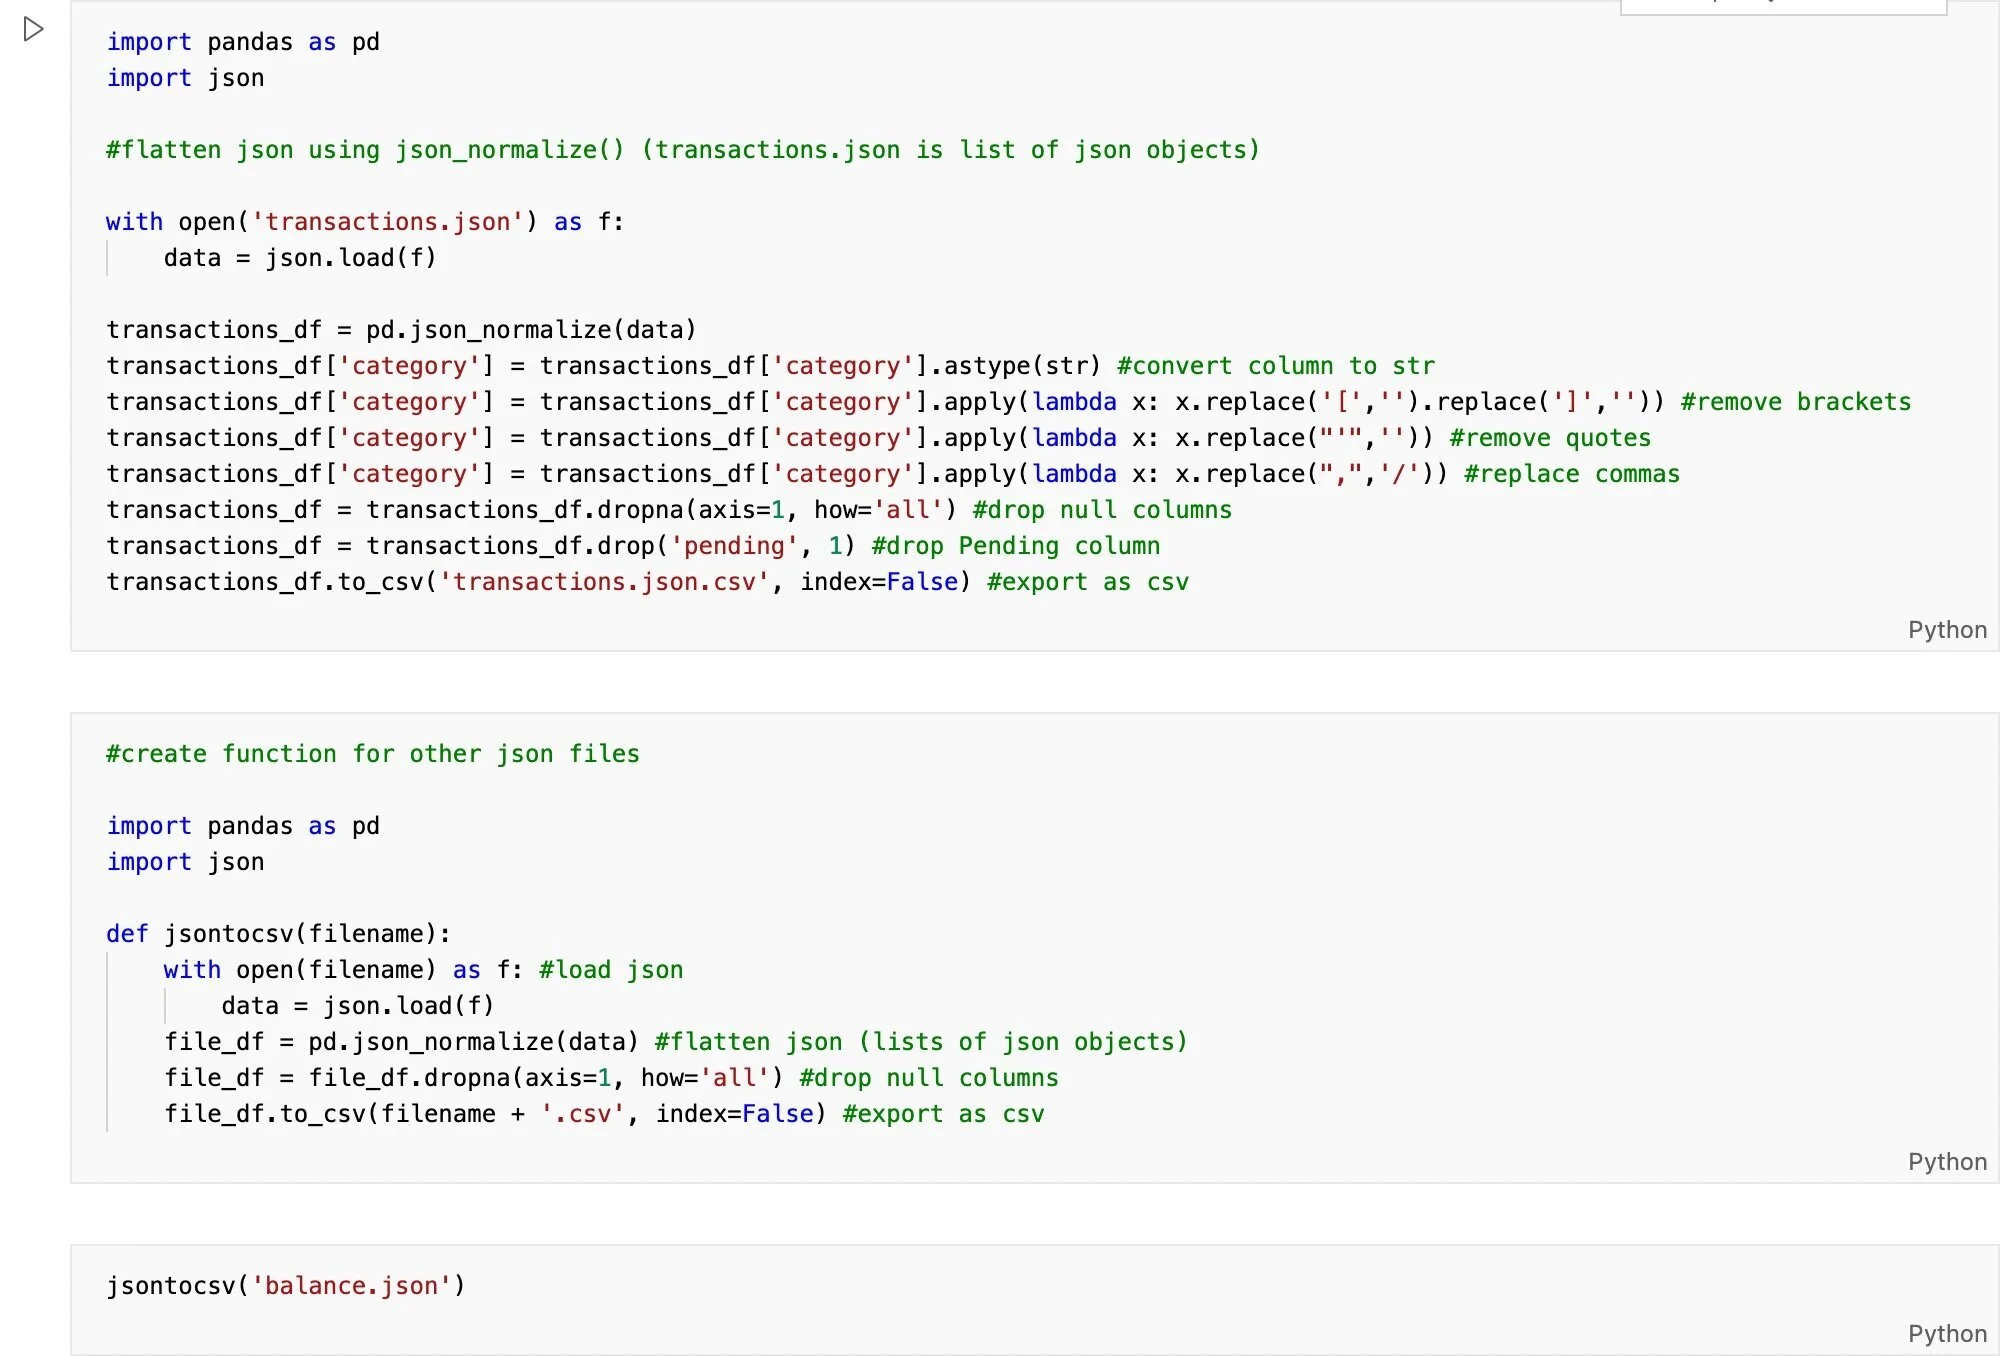
Postman extracts the data from Plaid’s API in nested JSON format so I first needed to transform the data by normalizing it into a flat table using the json_normalize method in Pandas. Next, I cleaned the data by removing unnecessary characters such as brackets and quotes as well as null columns and finally exported the data in CSV format.
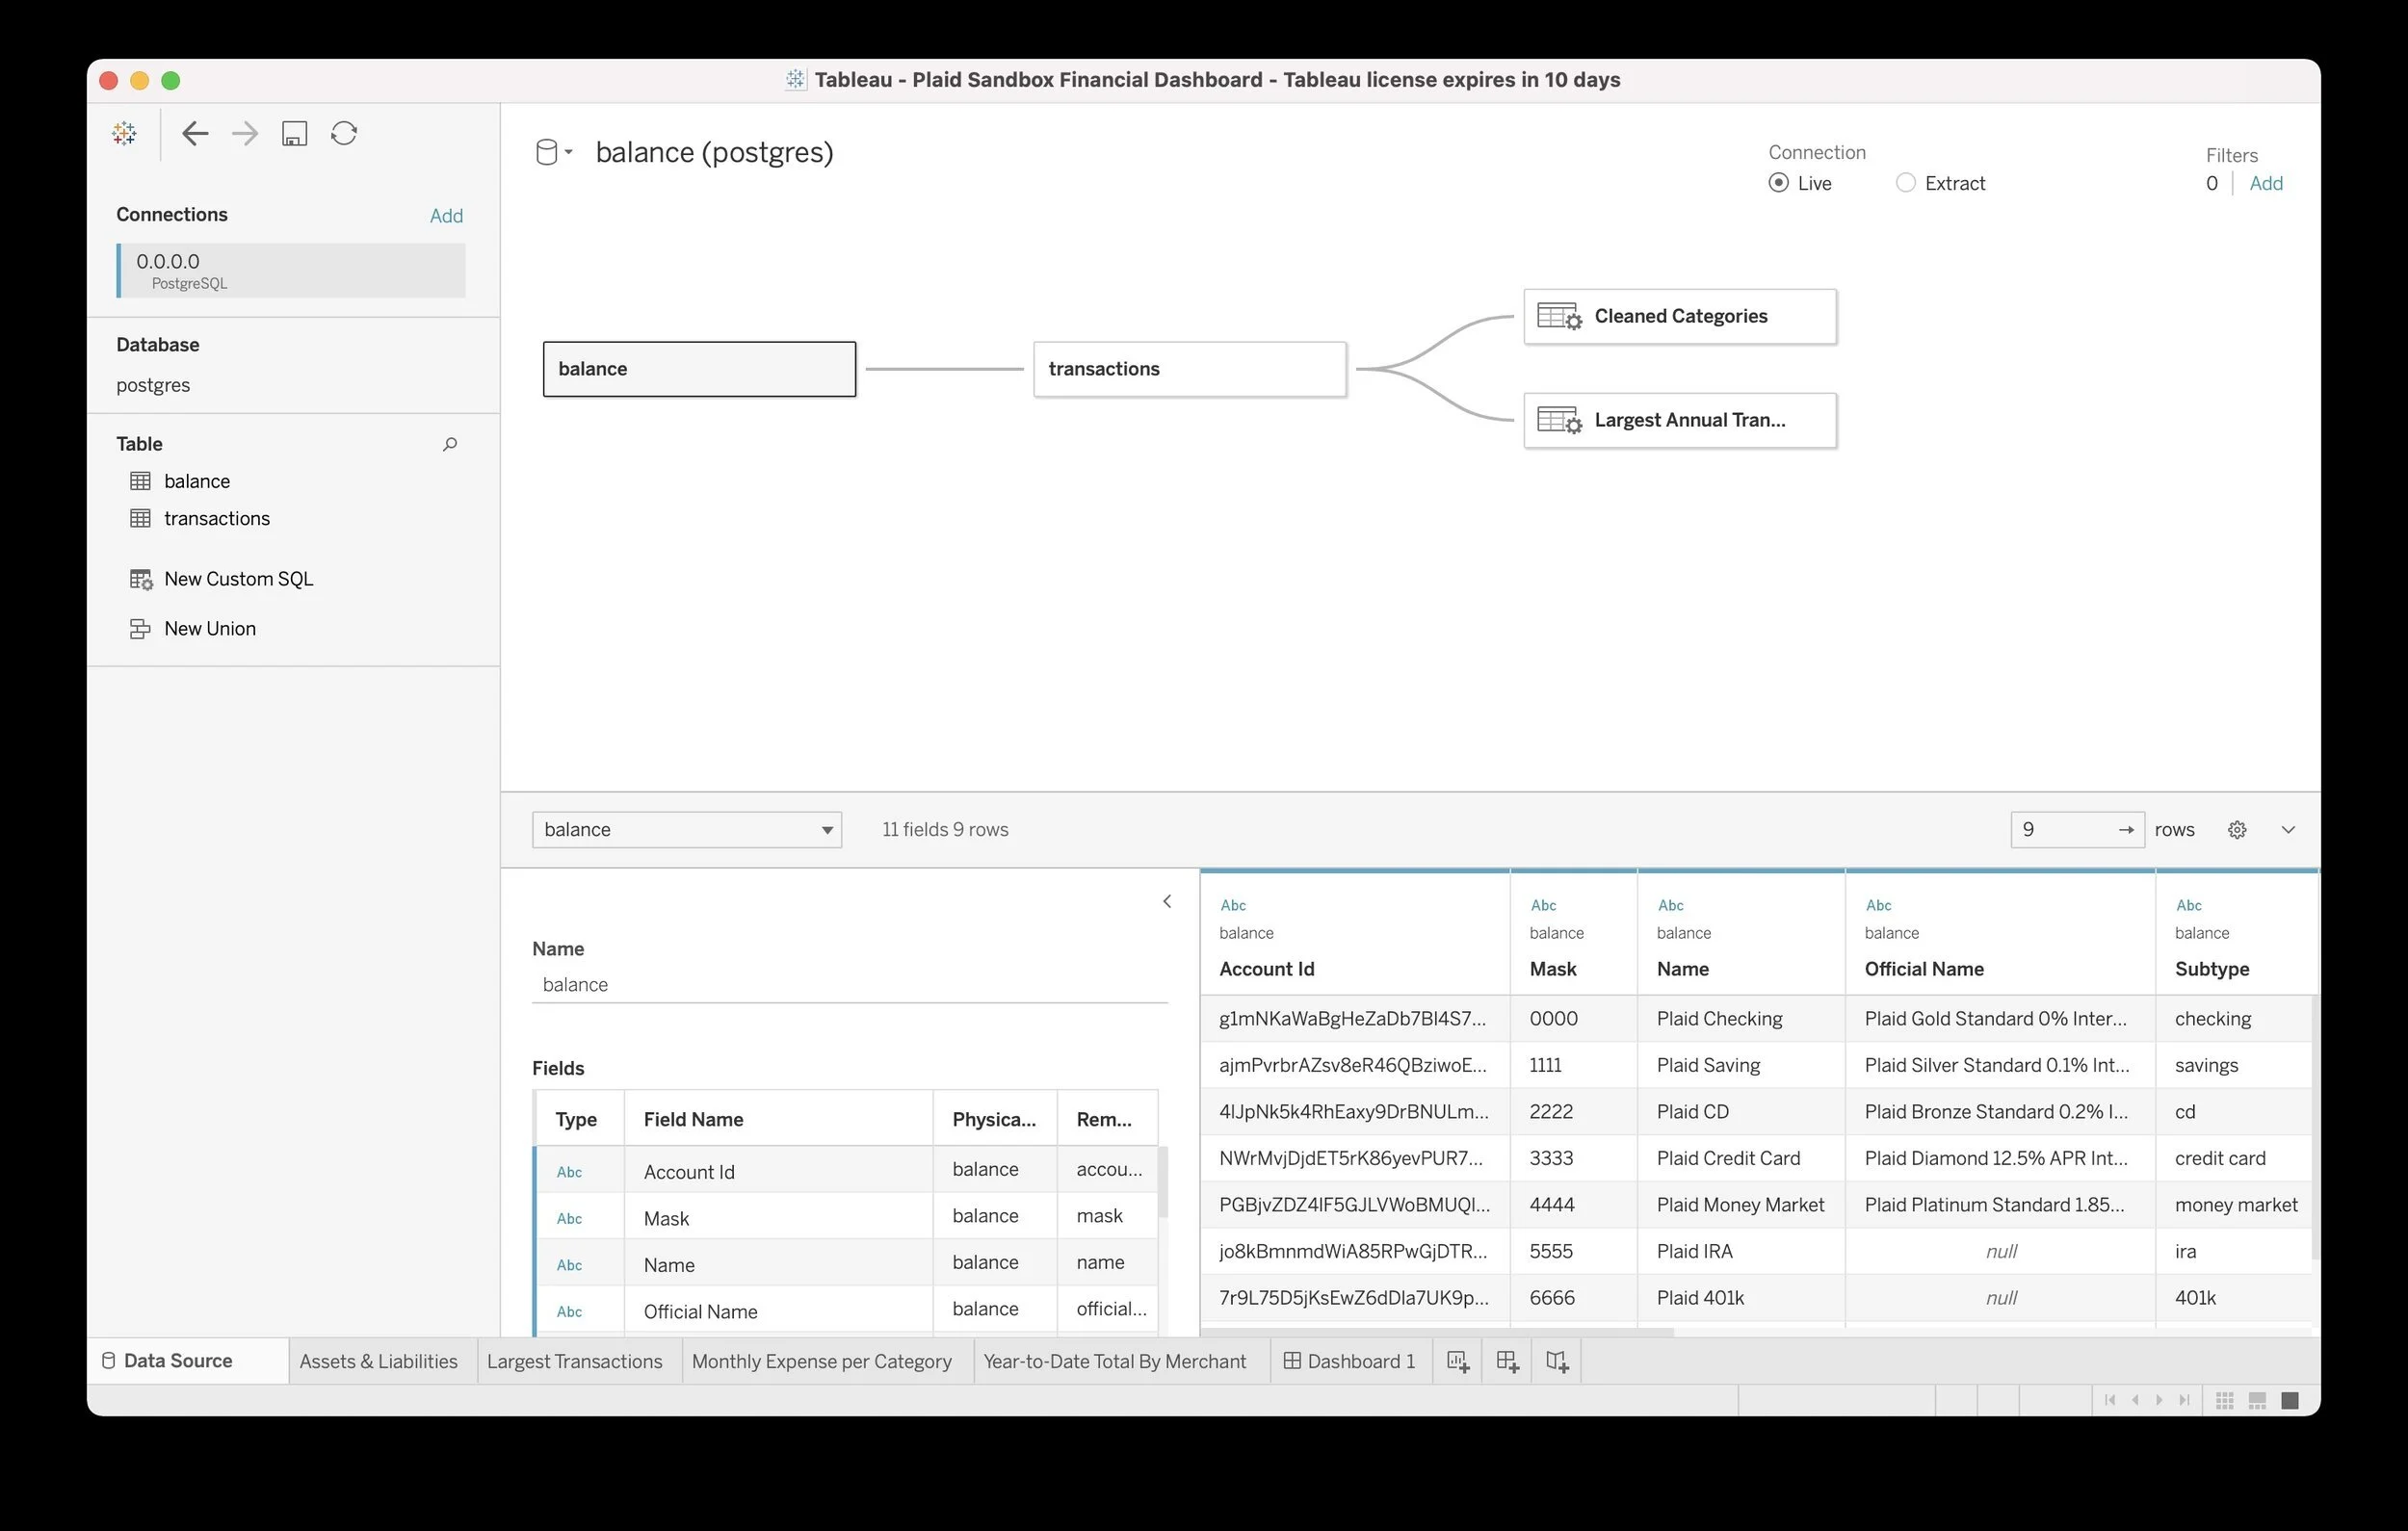
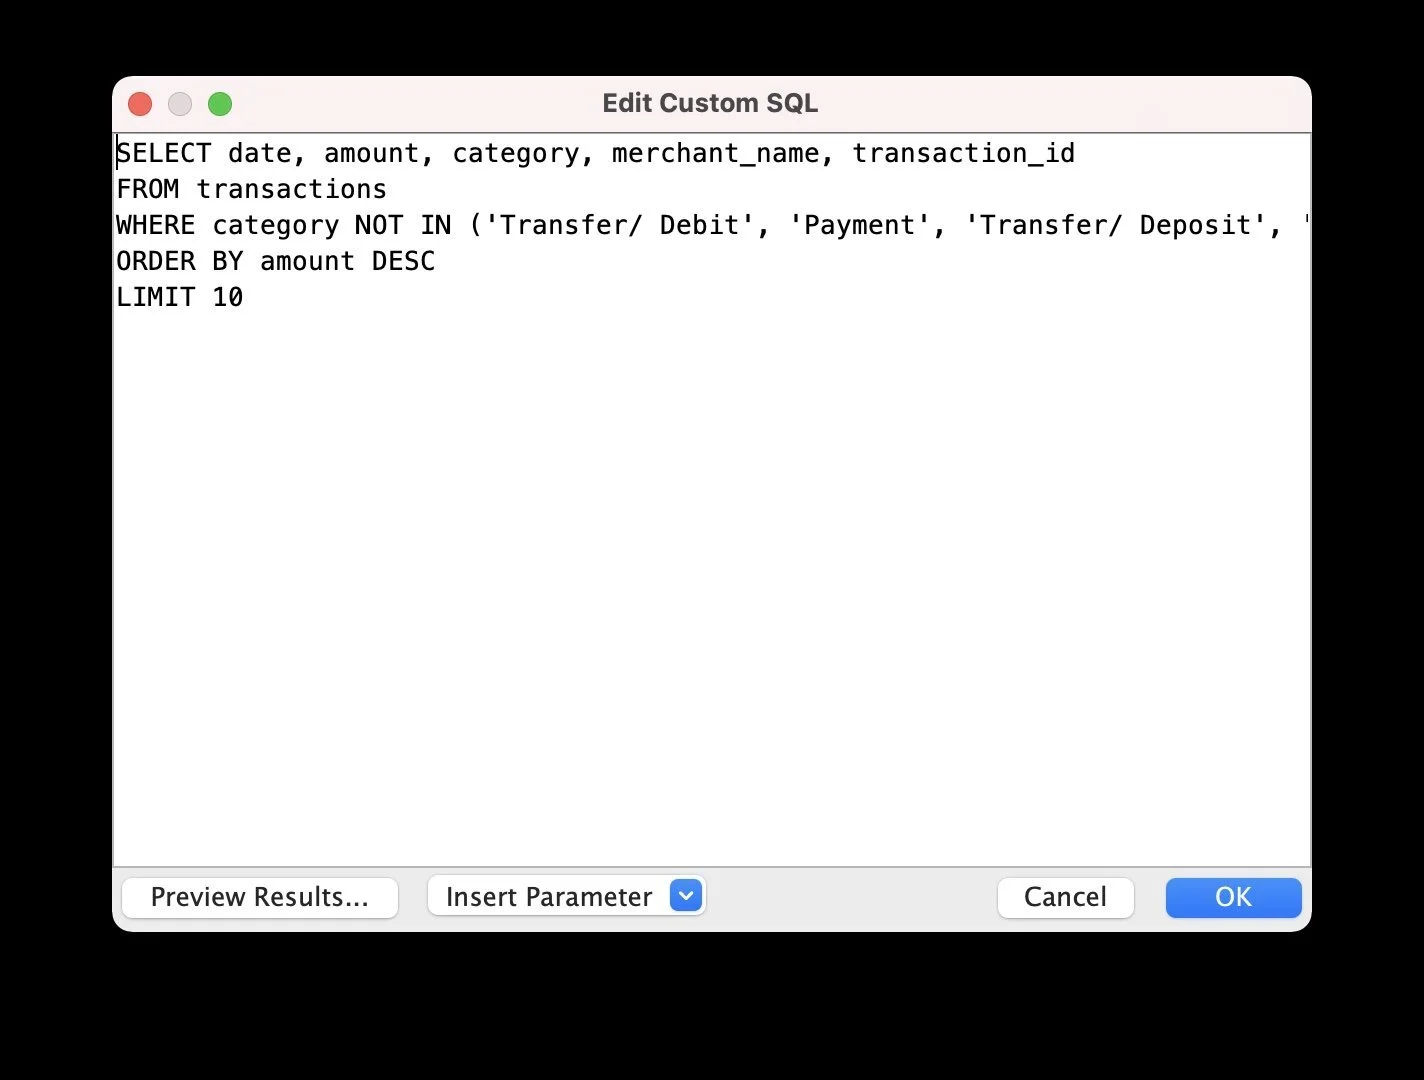
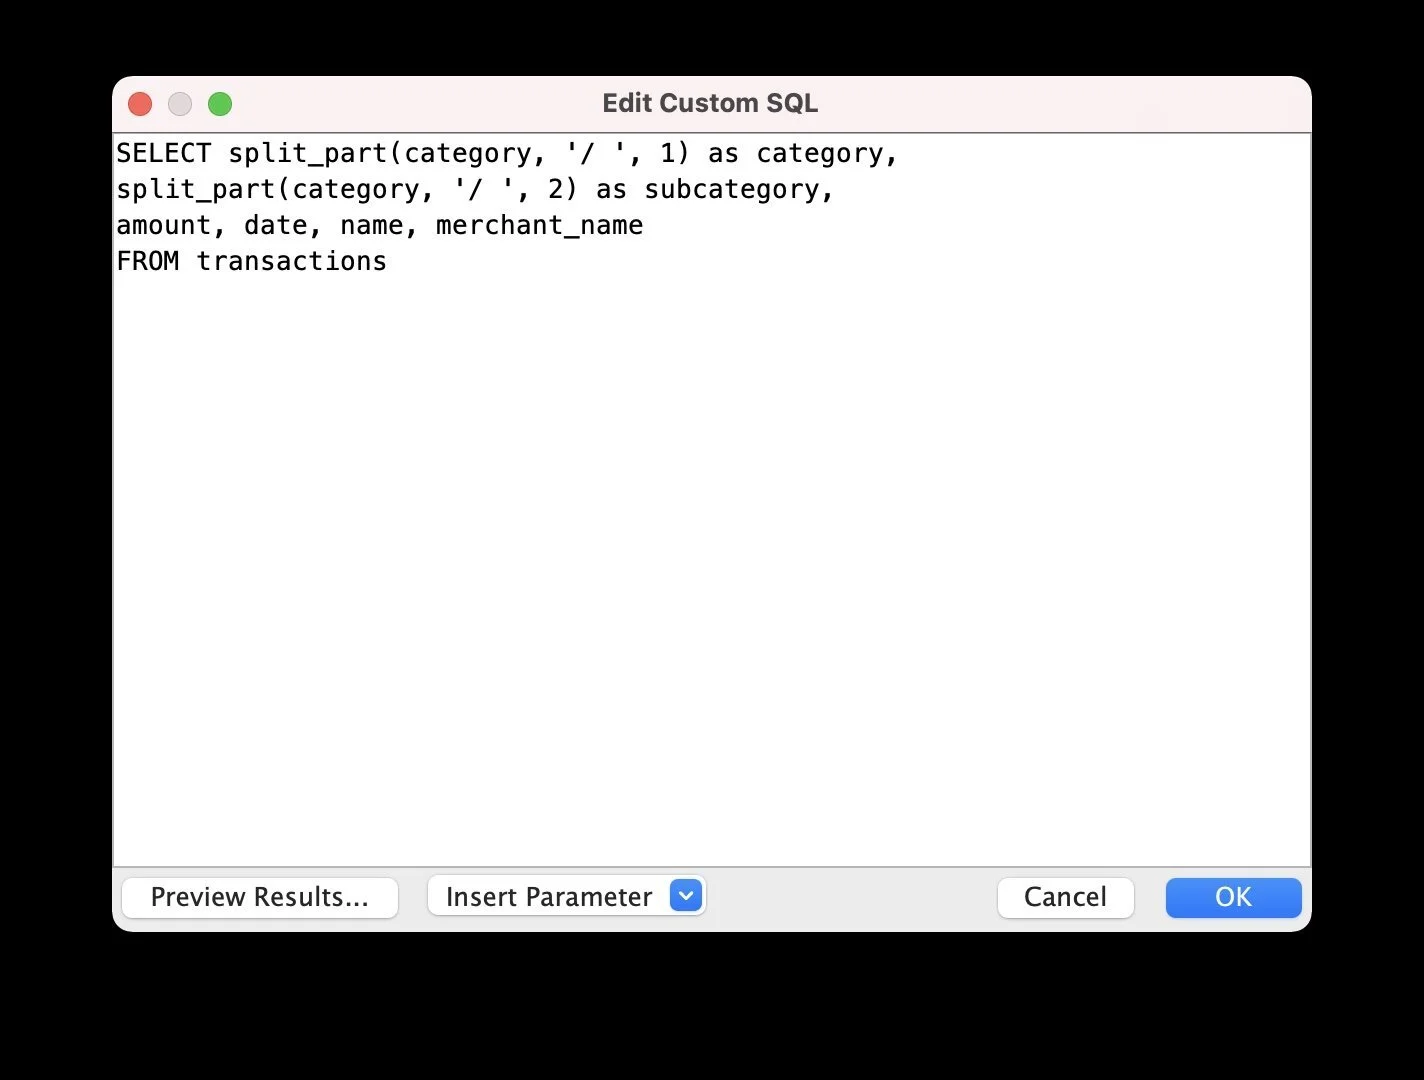
I created a Postgres database running within a Docker container and used pgAdmin to create two tables (Balance, Transactions) with the correct schema matching the Plaid API responses and loaded my CSV files into the appropriate tables. Next, I opened up Tableau Desktop, connected to my Postgres server and began to explore the data and build my dashboard. In order to do so, I needed to perform a few custom SQL queries in Tableau; for example, I needed to split a single category string into both a main category as well as a subcategory for more granular analysis as well as exclude certain types of transactions (e.g. deposits) because I was specifically interested in analyzing transactions with merchants. In addition, I created a calculated field in order to accurately portray negative values (i.e. deficits) while visualizing assets and liabilities.
This sample data is generated by Plaid and, as a result, is somewhat repetitive in its patterns; for example, there is a $500 charge each month to United Airlines and corresponding $500 refund that balances out that subcategory. Additionally, although I requested one year of data from the Plaid API, it only returned six months of data from March to September 2021 which is likely a limitation of the sandbox data. However, I think the most interesting thing about this data actually isn’t the specific data at all but rather the ability for a user to just as easily use the Plaid API to access their own financial accounts, load the results into a database and create a powerful dashboard or fintech app of their own. Combined with the rapid growth of “open banking,” which provides a third party such as a fintech app the ability to access financial data from a bank through an API, Plaid is poised to continue powering the fintech boom.
-
![]()
Retrieving sample data from the Plaid API using Postman
-
![]()
Python function to flatten and clean original JSON
-
![]()
Setting up Postgres database within Docker
-
![Screenshot of a Tableau financial dashboard showing a database with transaction details, including account ID, mask, name, official name, subtype, and balance. The dashboard includes a data connection to Postgres and filters for live or extract connection, with visible tabs for data source, transactions, largest transactions, and monthly expenses.]()
Balance and transaction tables matching Plaid API schema
-
![Screenshot of a SQL query editor window showing a SELECT statement to retrieve transaction data from a database, with options to preview results or insert parameters.]()
Custom SQL query to exclude certain types of transactions
-
![Screenshot of a SQL code editor window with a query for splitting transaction data into categories and subcategories.]()
Custom SQL query to split category string for more granular analysis
-
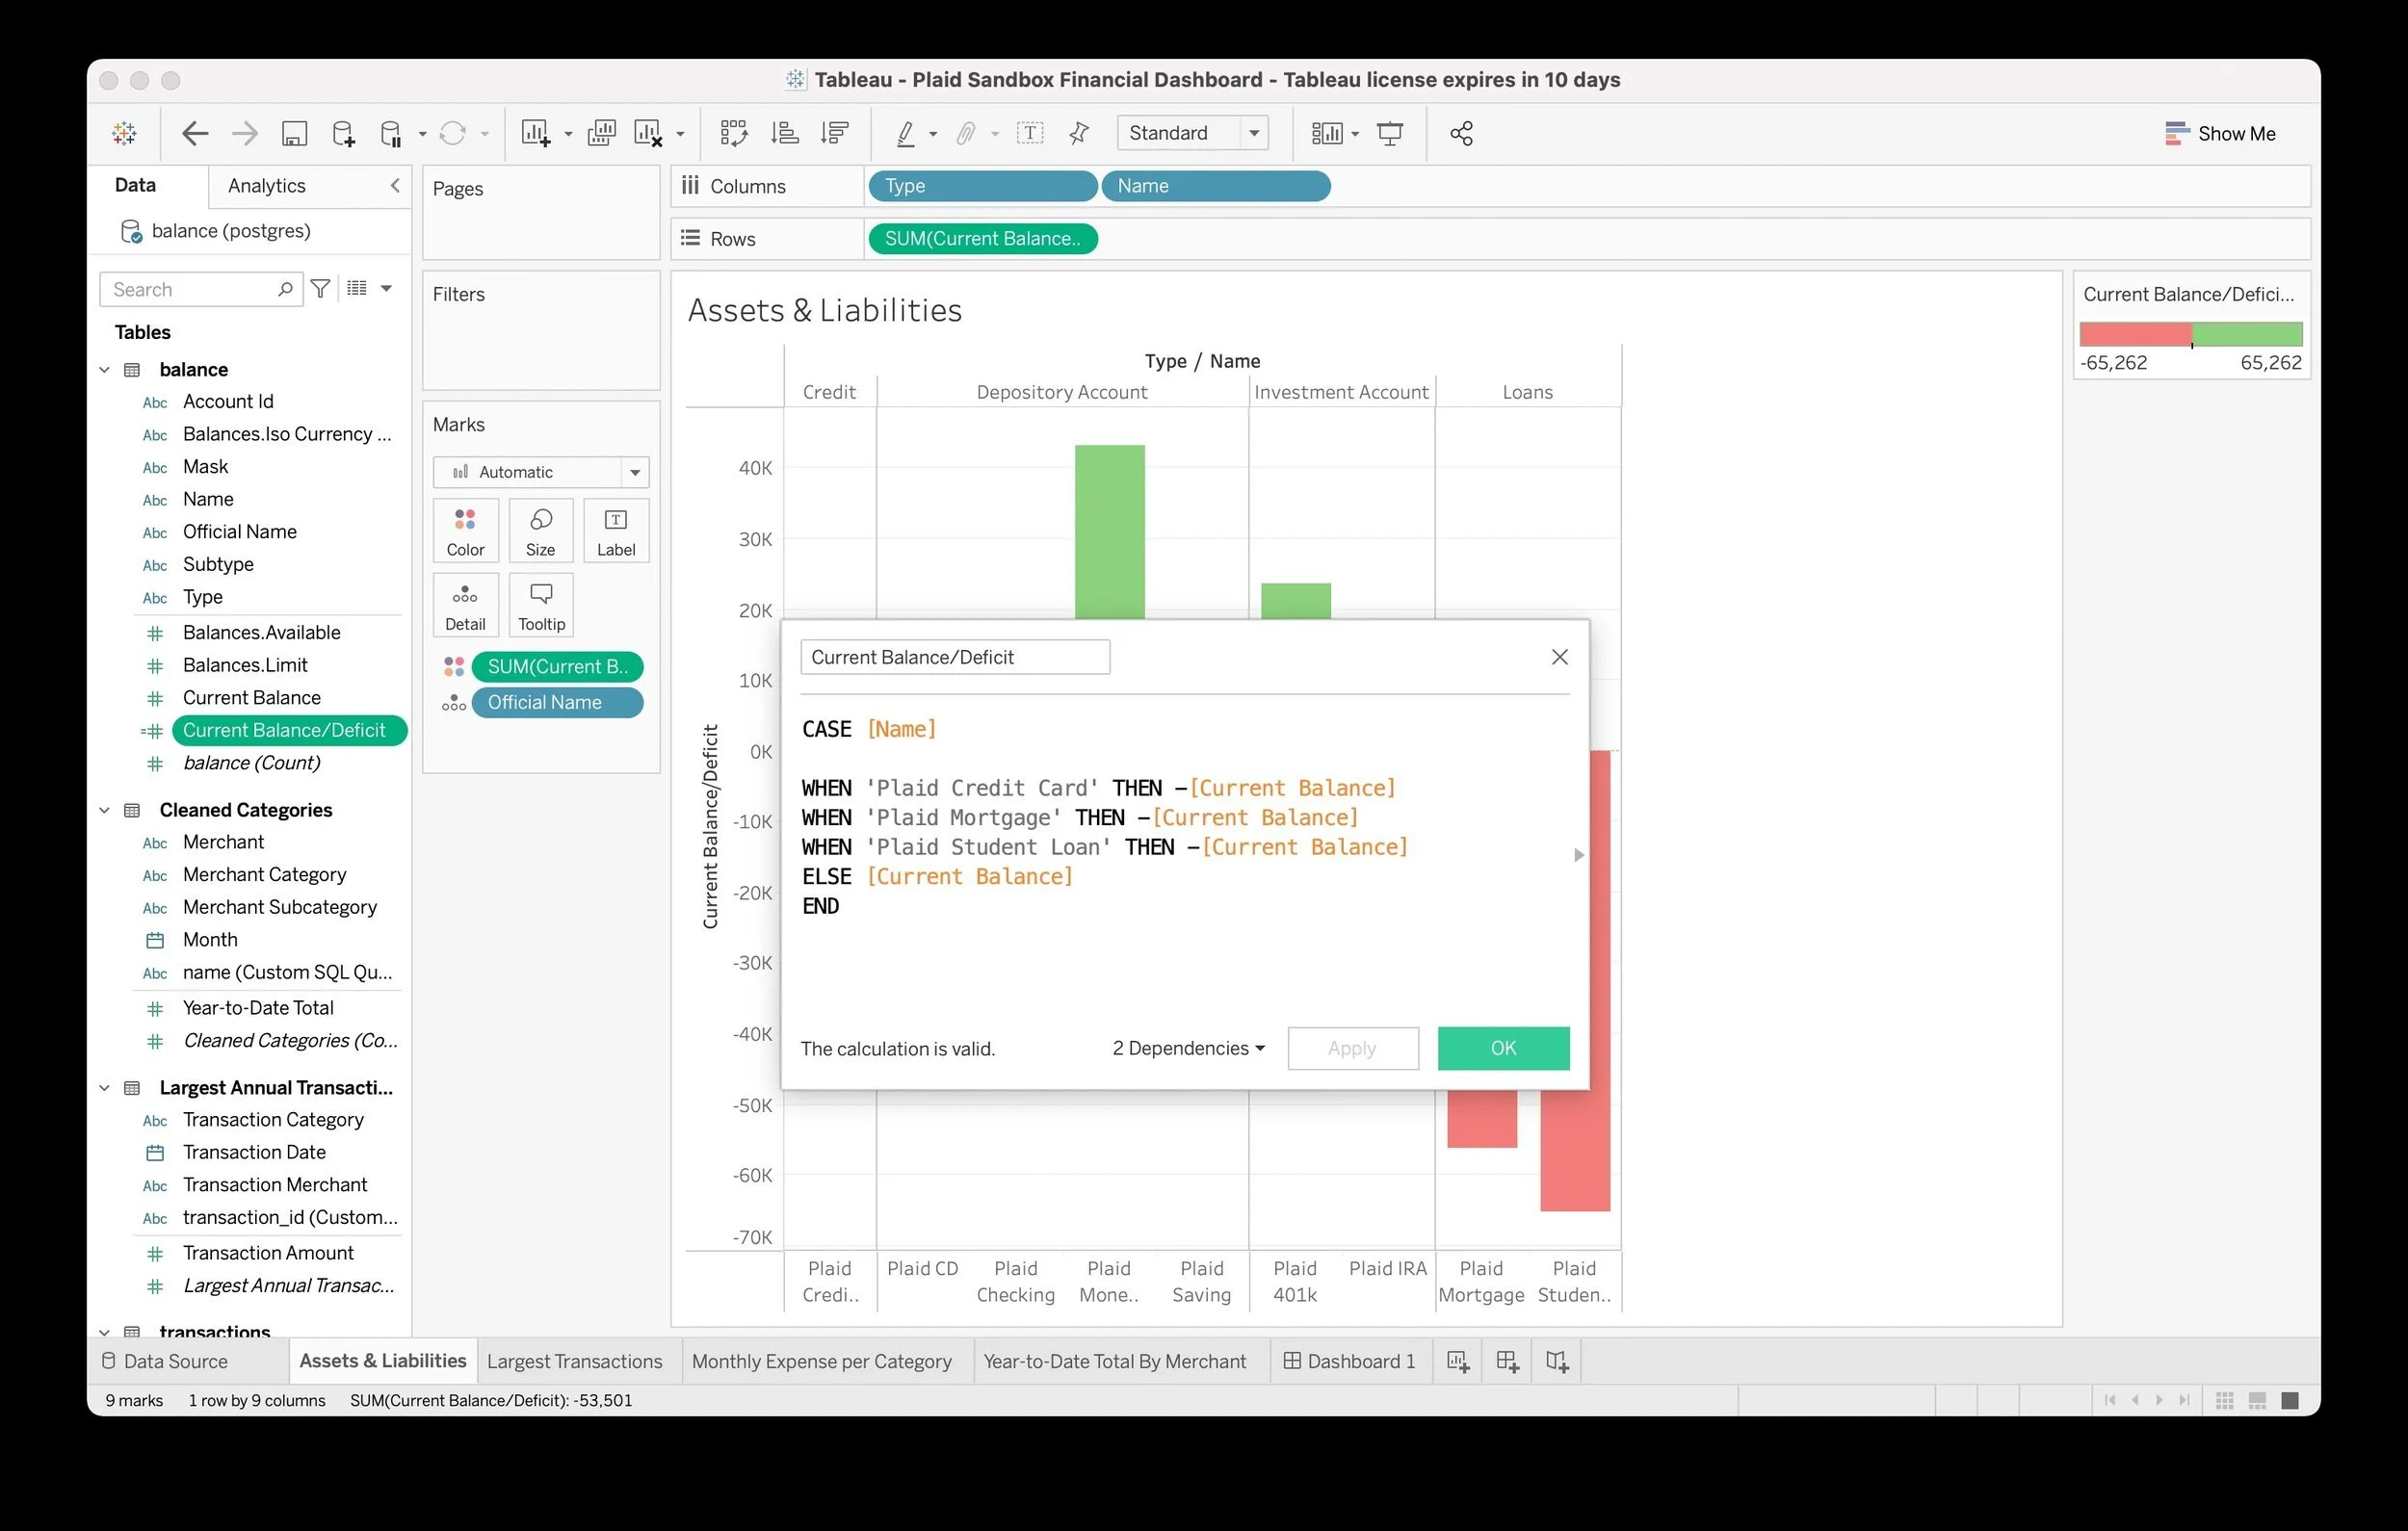
![A screenshot of a Tableau financial dashboard showing an assets and liabilities chart, a pop-up calculation dialog for current balance or deficit, and various data fields and filters on the screen.]()
Calculated field in Tableau to correctly display deficits

Methodology v2 (with dbt)
Building a data science portfolio requires owning the entire data stack from beginning to end to produce the final product (e.g. a Tableau dashboard) and I’ve most often relied upon an extract, transform, load (ETL) process to prepare the data for analysis. However, this framework created certain complications; specifically, it lacked the modularity to experiment with transformations without compromising data integrity as well as the transparency to trace where any particular error originated during the process. Traditional data teams have faced similar challenges over the past decade but recent advances such as cloud-based data warehouses and data pipeline services have accelerated an industry shift from ETL to ELT.
In addition, the new title of analytics engineer has increasingly become common to describe the person who owns the entire data stack as I had for my past projects. I recently discovered data build tool (dbt), a popular ELT data transformation tool that enables data analysts and engineers to transform, test, and document data in their cloud warehouse, and decided to revisit this project by rebuilding the data stack from scratch as an analytics engineer using BigQuery and dbt.
Modular data modeling in dbt allows analytics engineers to build dependencies between sources (defined using YML files) and models (SQL files written as select statements) using dbt functions such as source() and ref(). As a result, source-centric models, such as staging models, can be easily recombined as needed to create business-centric marts models that can then be used downstream to inform business decisions. Additionally, the ref() function replaces the practice of hard-coding table names, which can result in problems if a typo is made, while the source() function allows dbt to check the freshness of raw tables in the data warehouse using the dbt source freshness command.
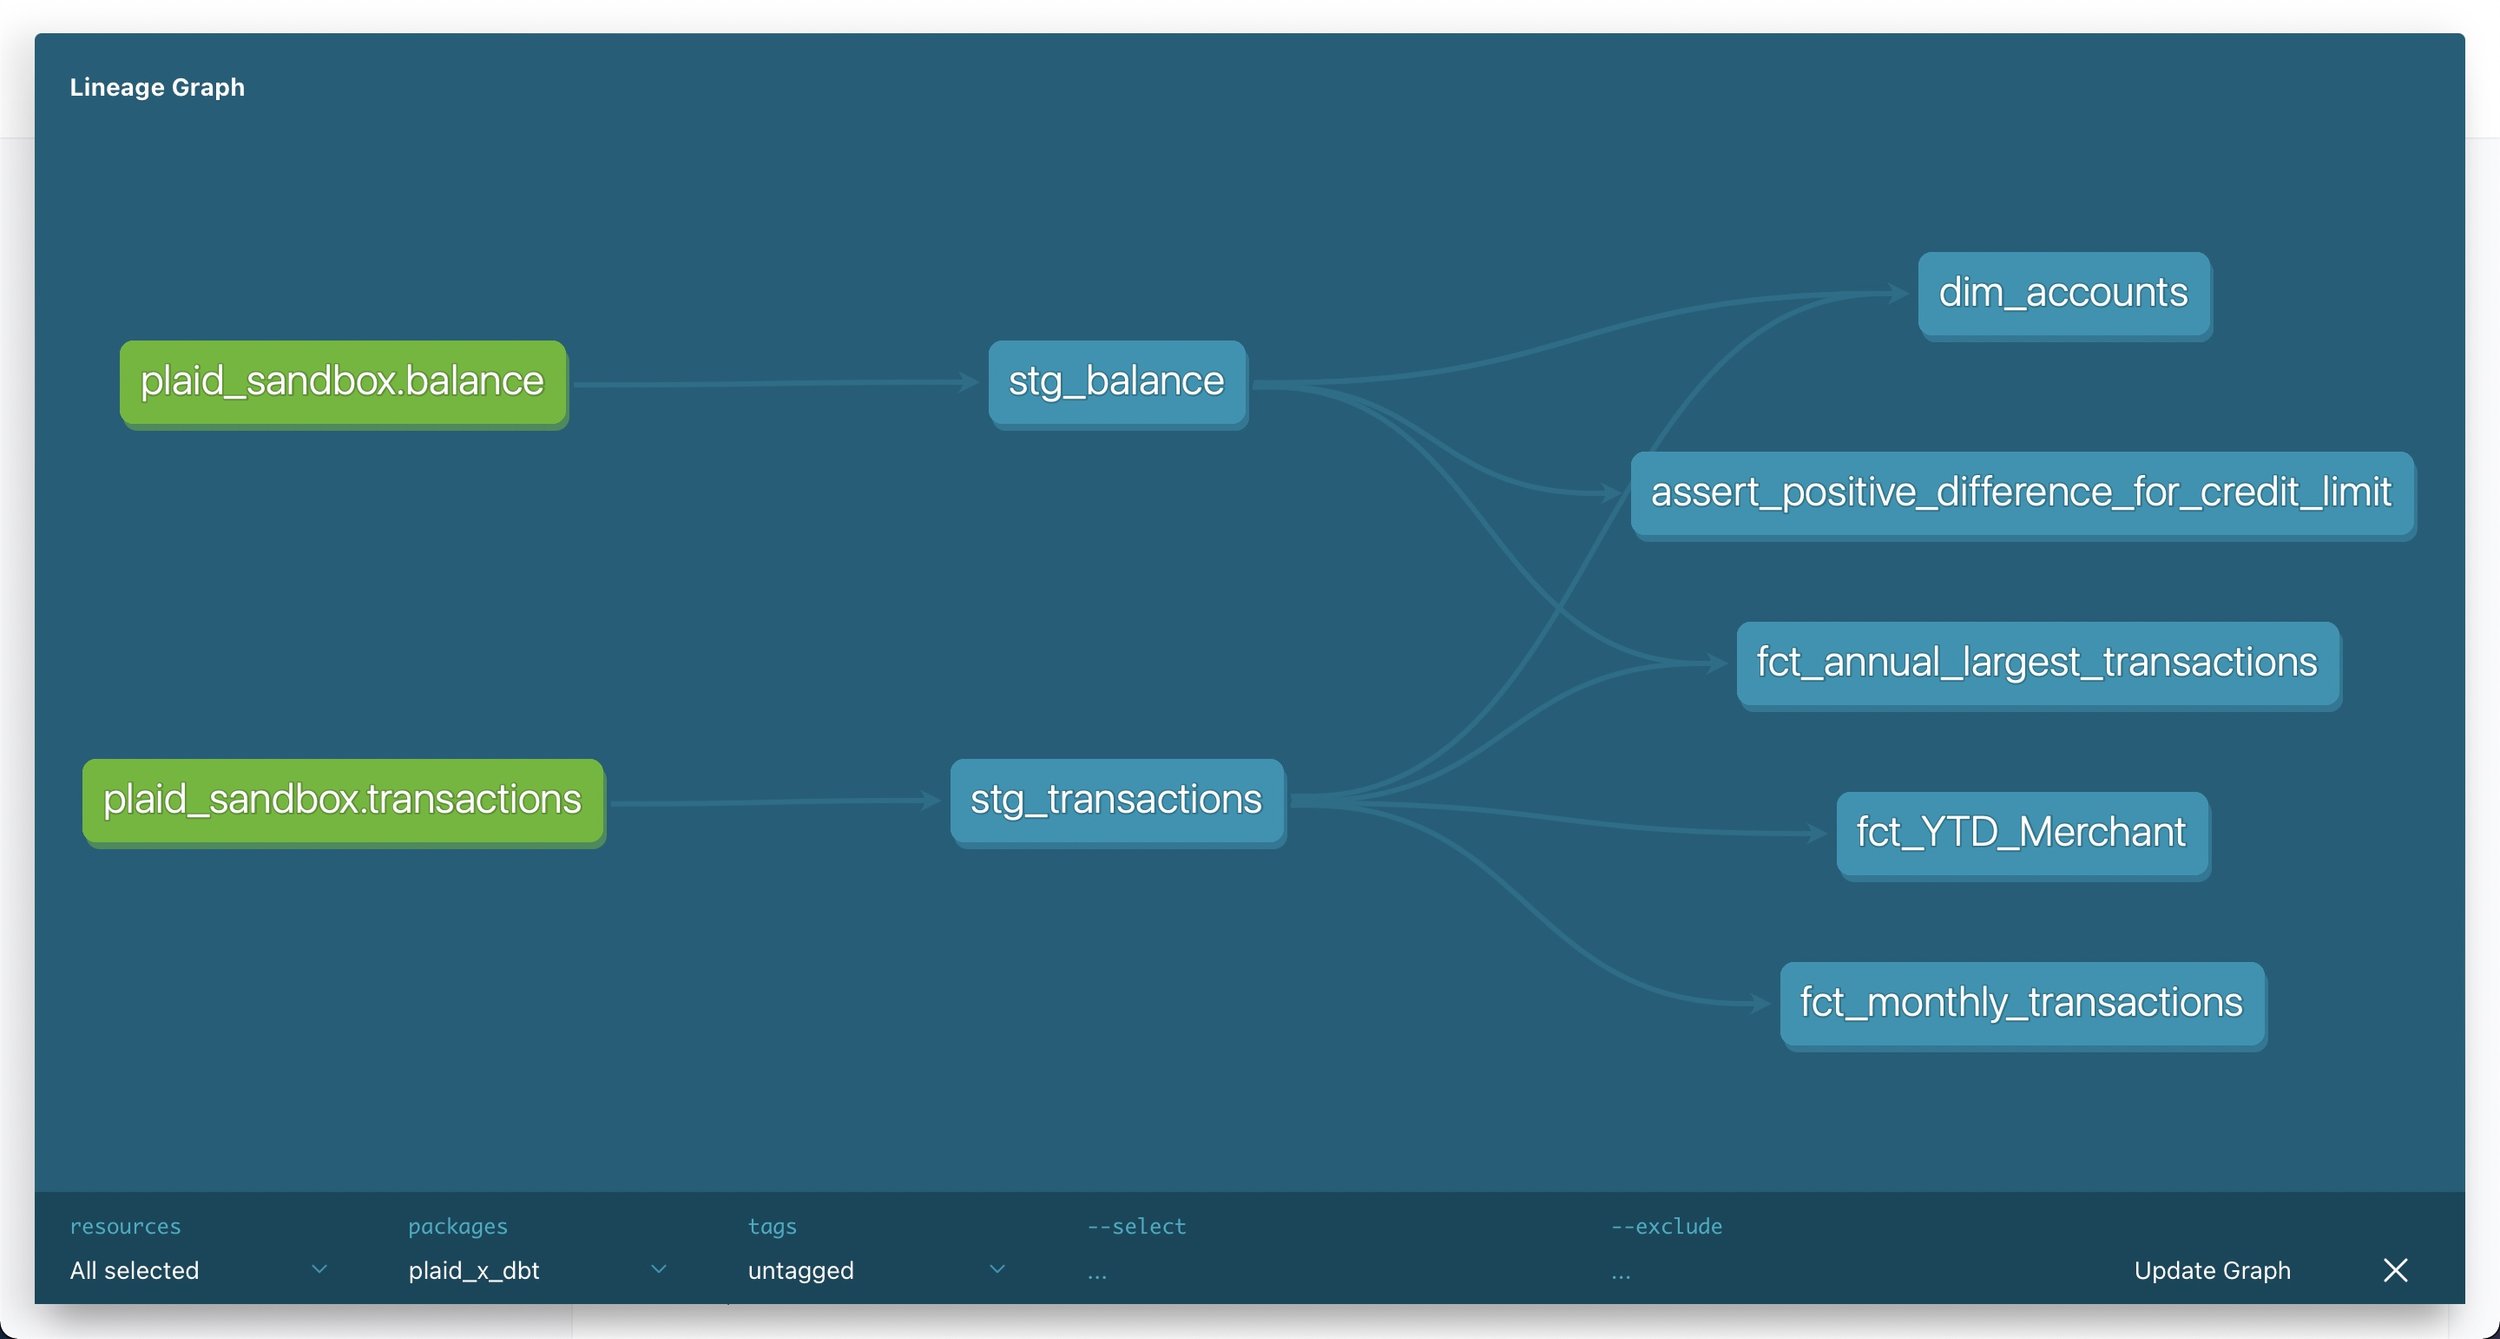
dbt provides full transparency about models, sources and their interdependencies by automatically generating documentation such as descriptions about models, sources and columns as well as the directed acyclic graph (or DAG), which provides a visual representation of dependencies between sources and models. Combined with documentation added by the user in YML files close to the actual code, these resources empower other stakeholders in the organization to easily answer their own questions and thereby reduces the burden on analytics engineers.
-
![]()
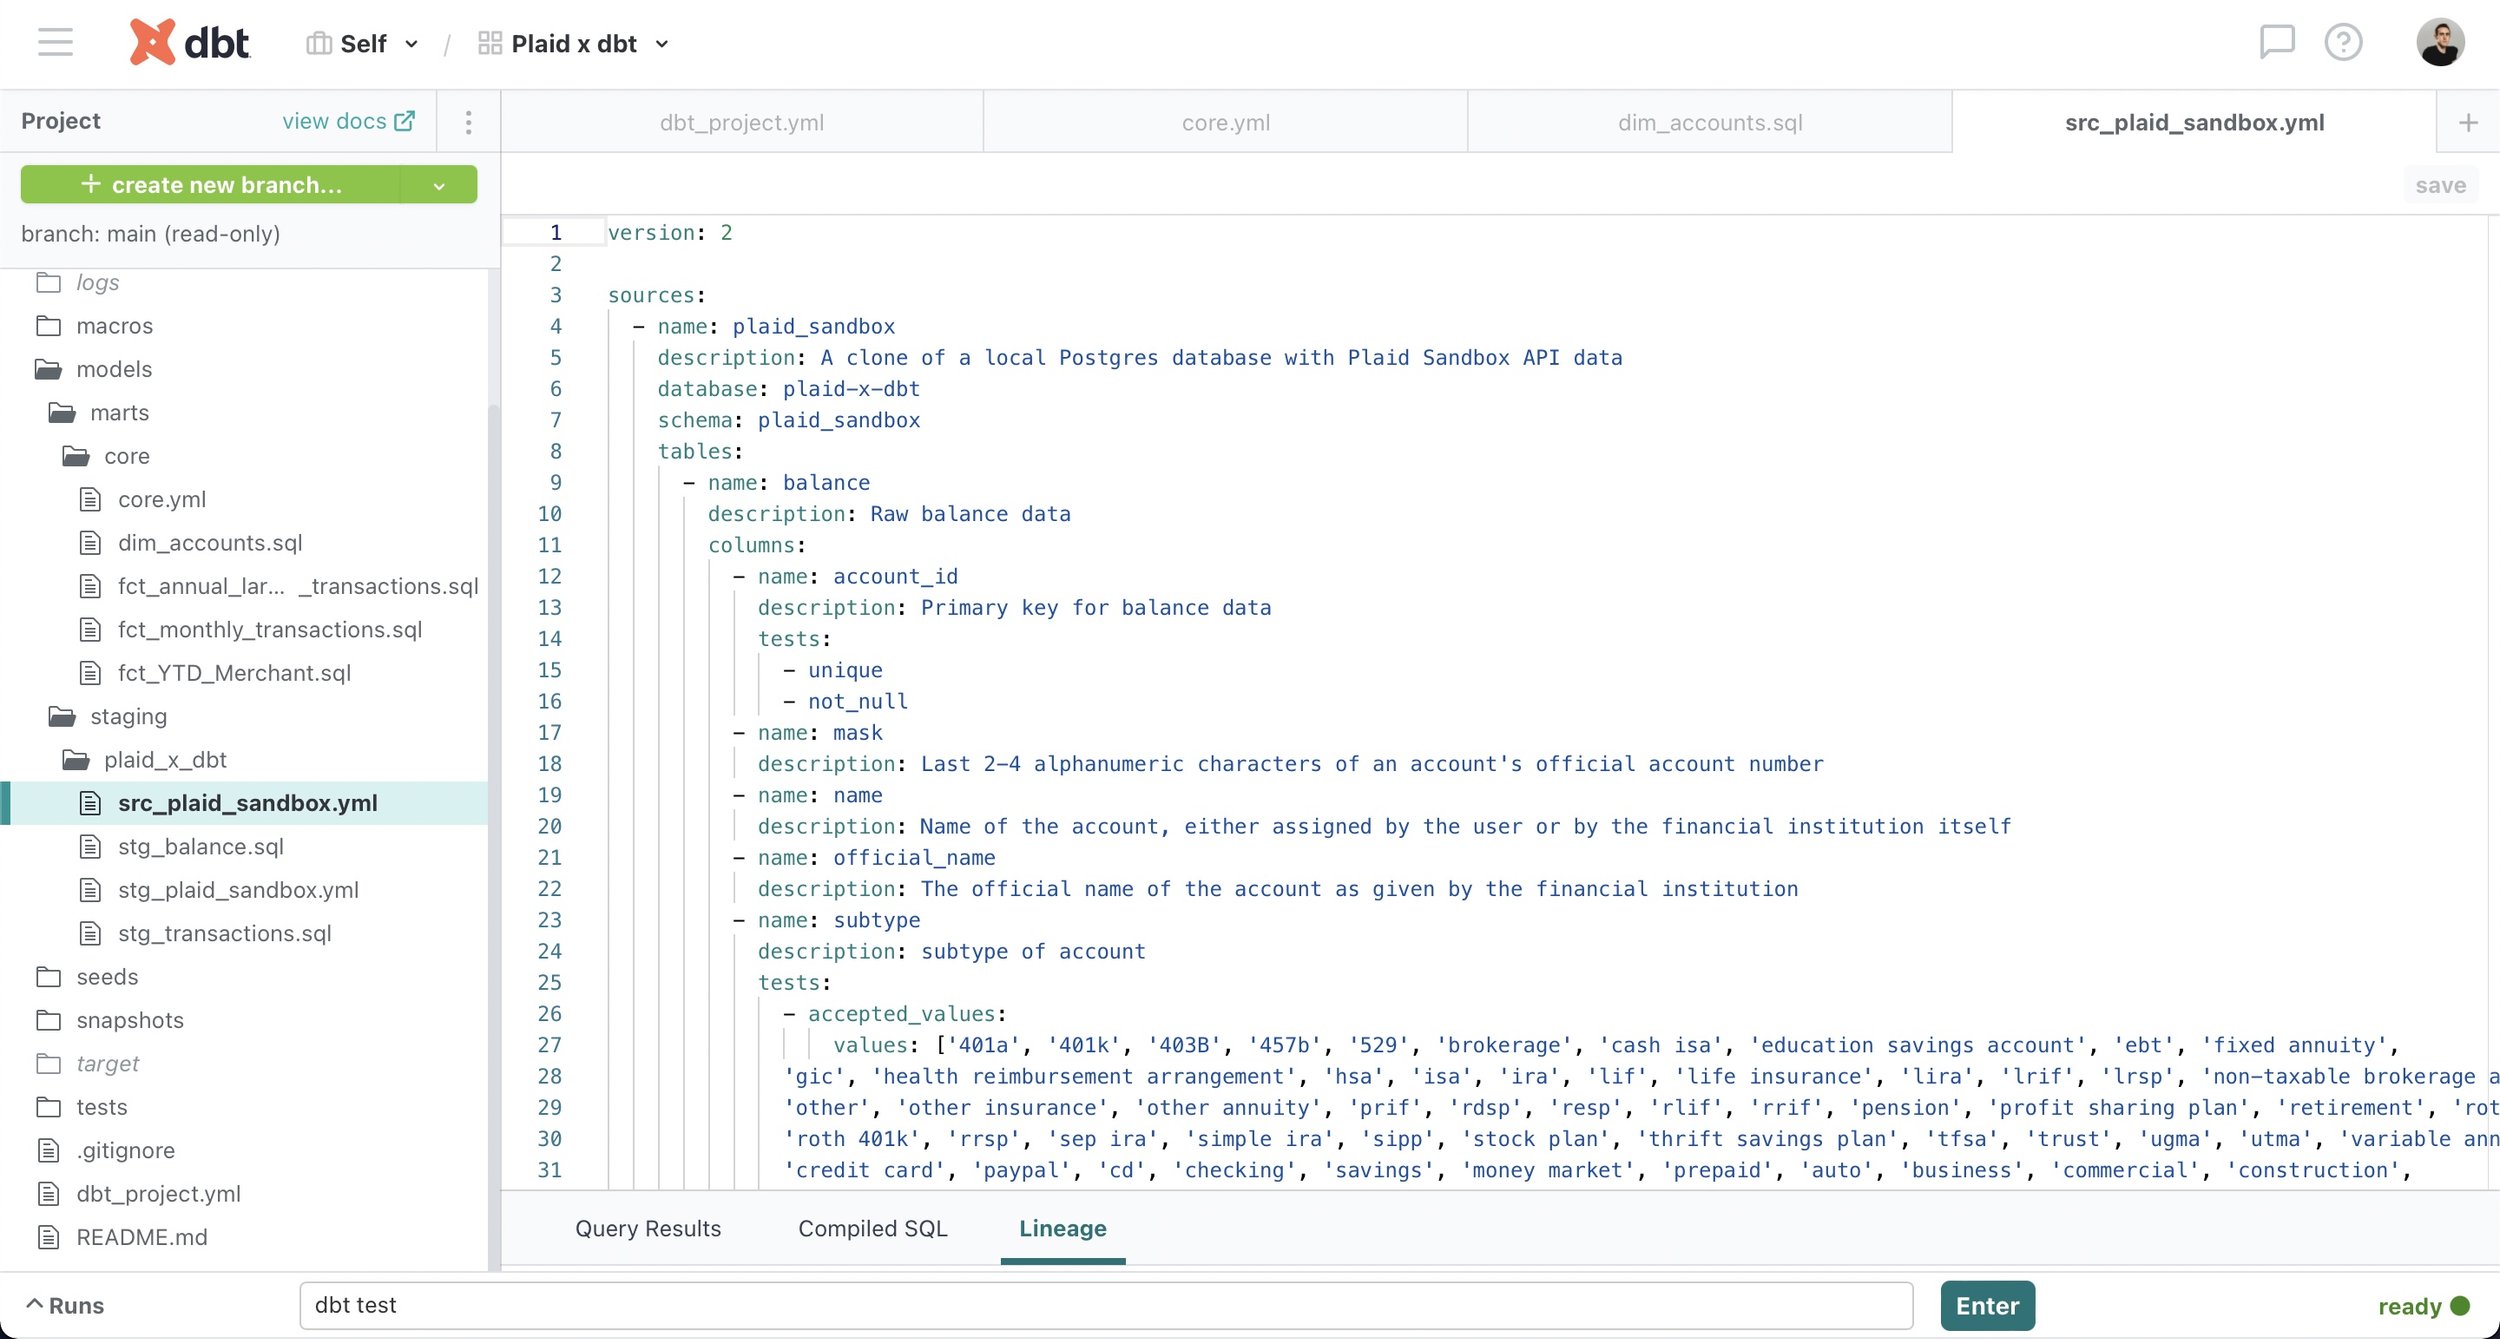
Source table
-
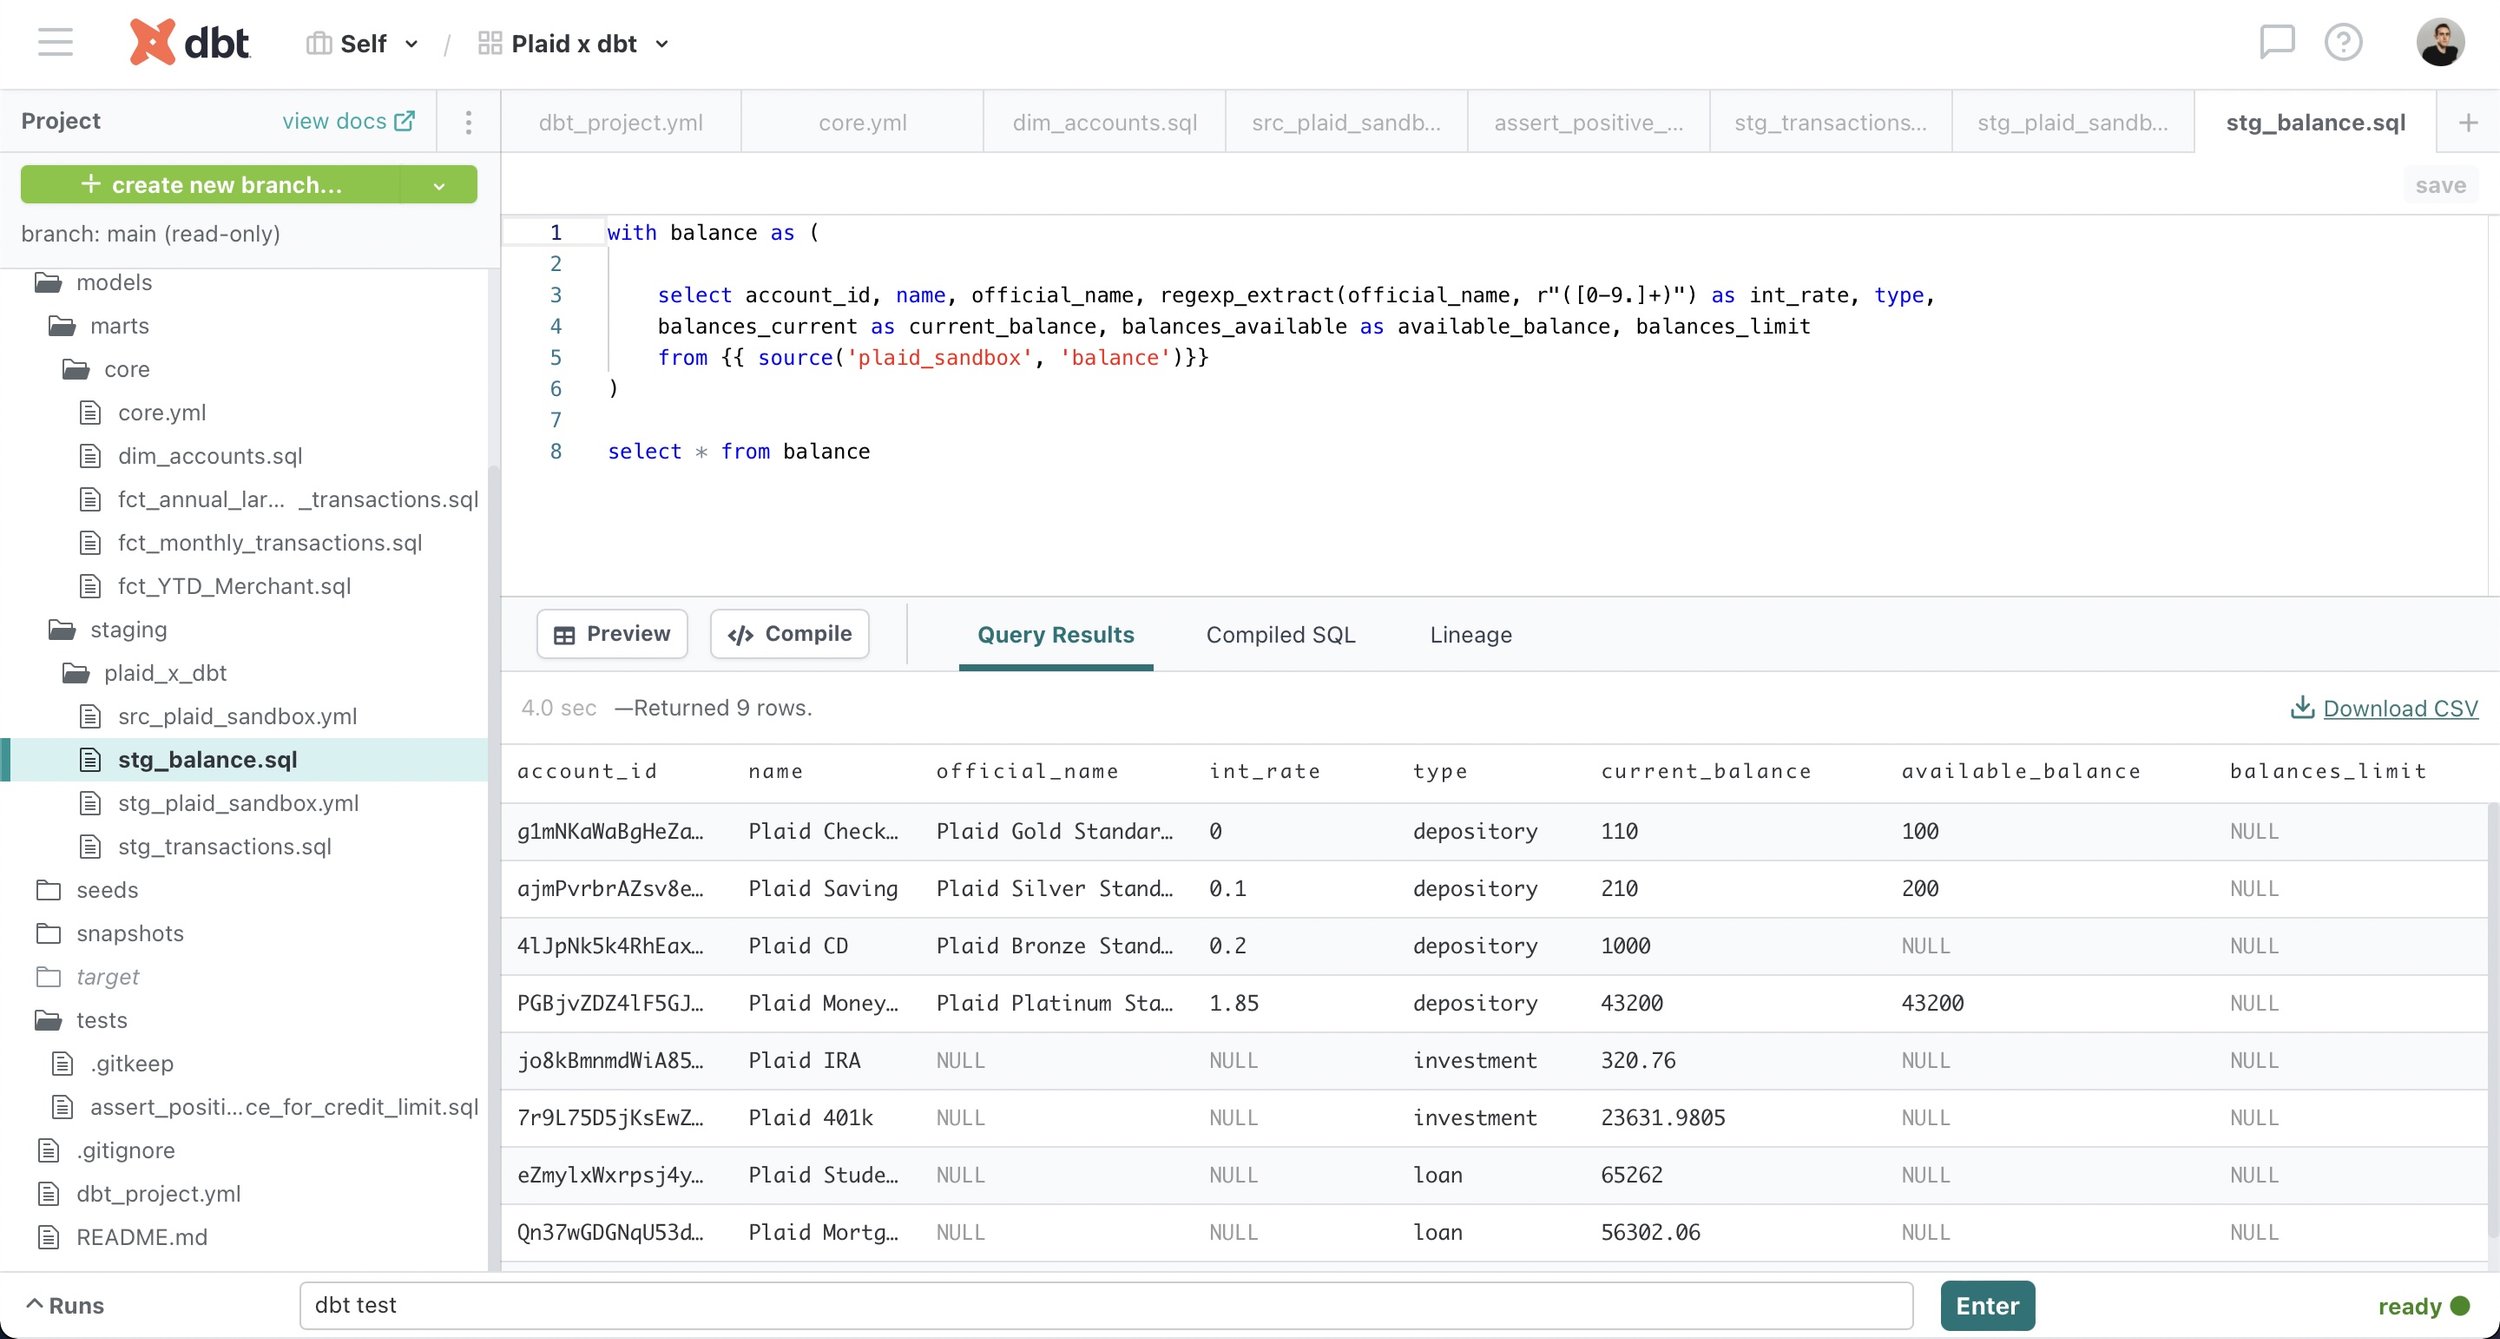
![]()
Staging table
-
![]()
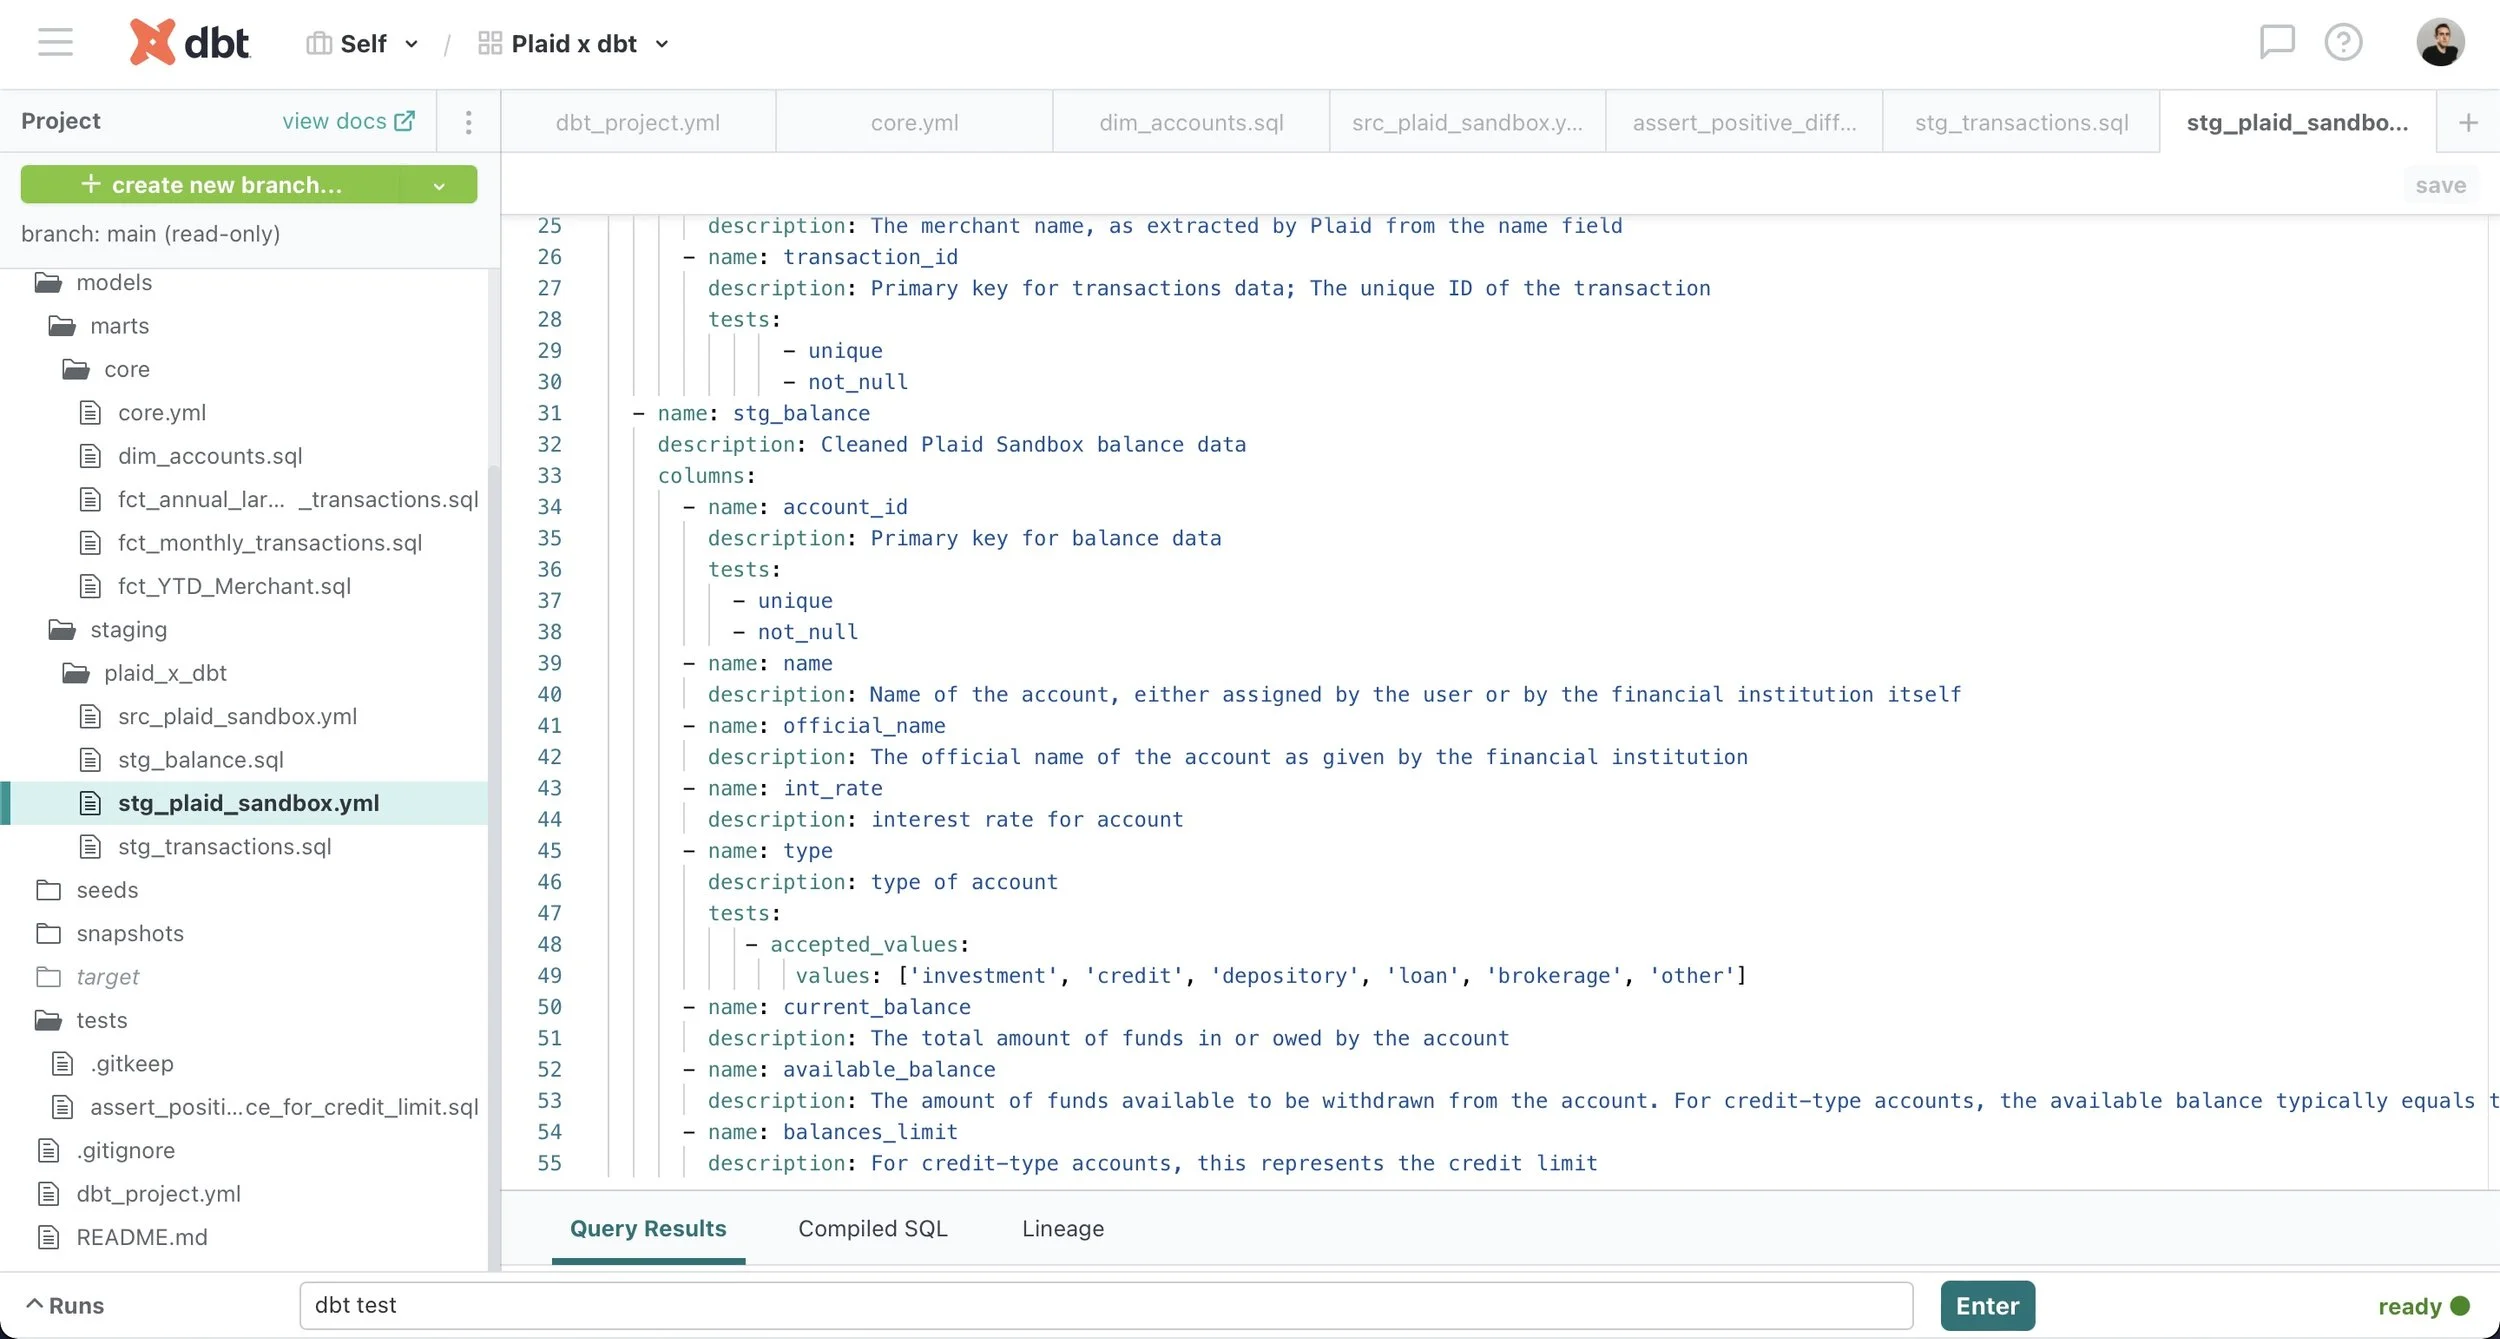
YML file
-
![]()
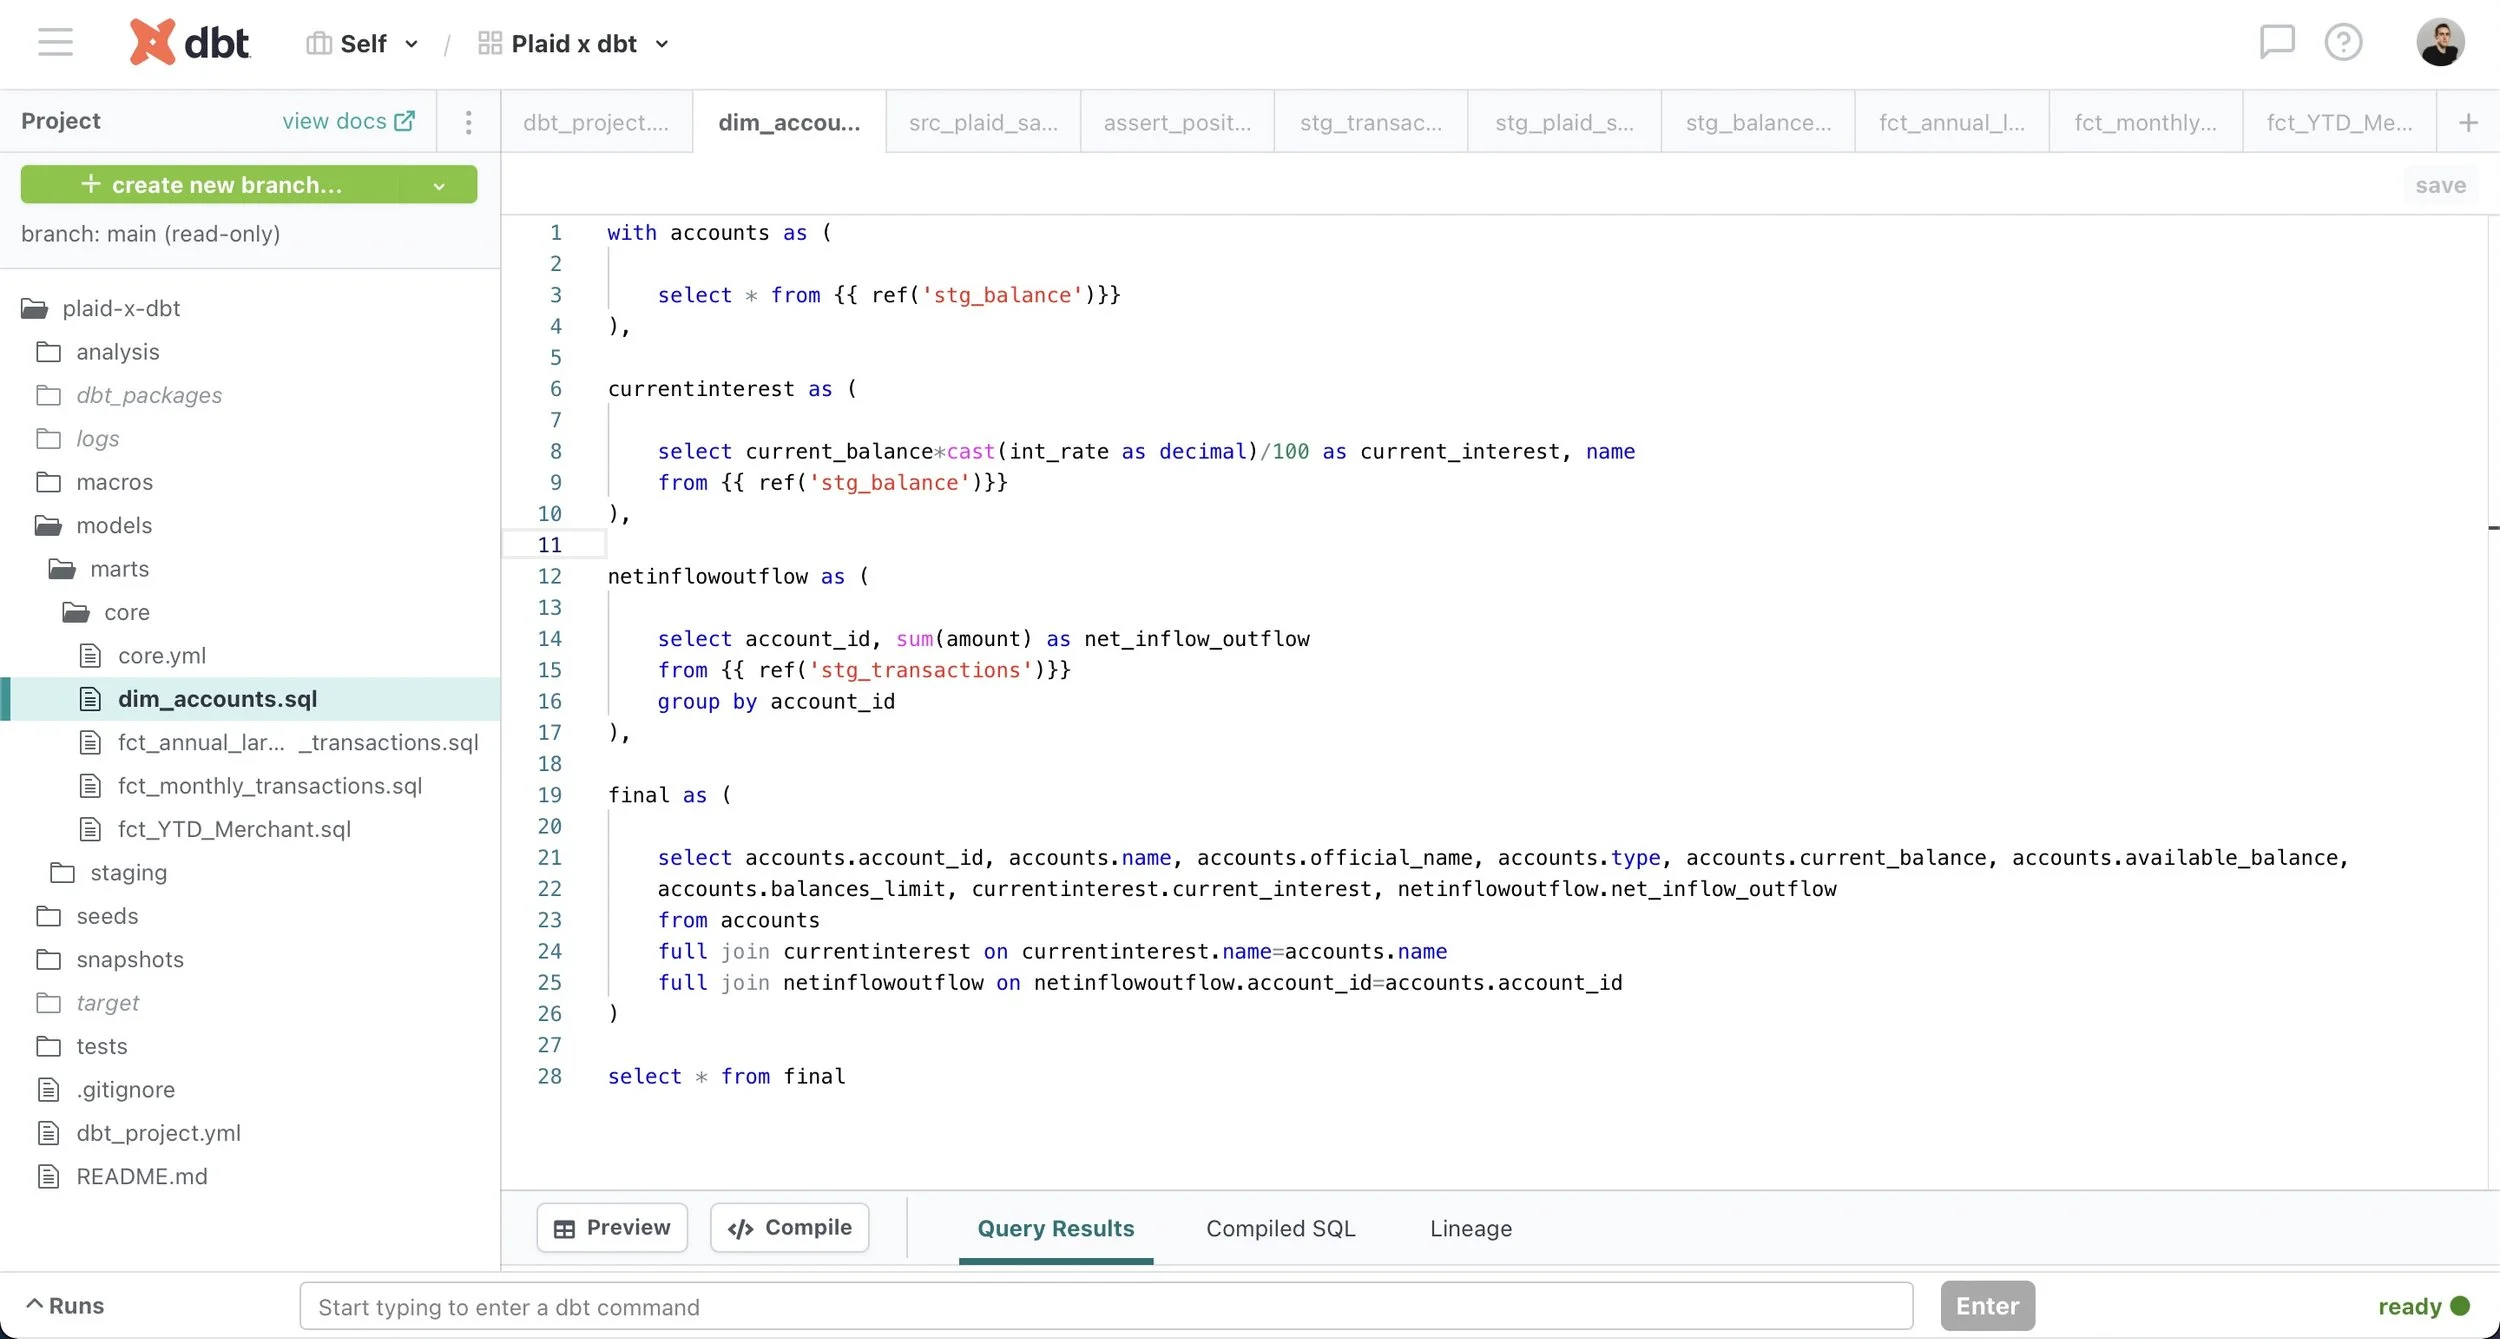
Dimension model
-
![]()
Fact model (largest annual transactions)
-
![]()
Test (assert positive difference)
-
![]()
Final DAG
-
![]()
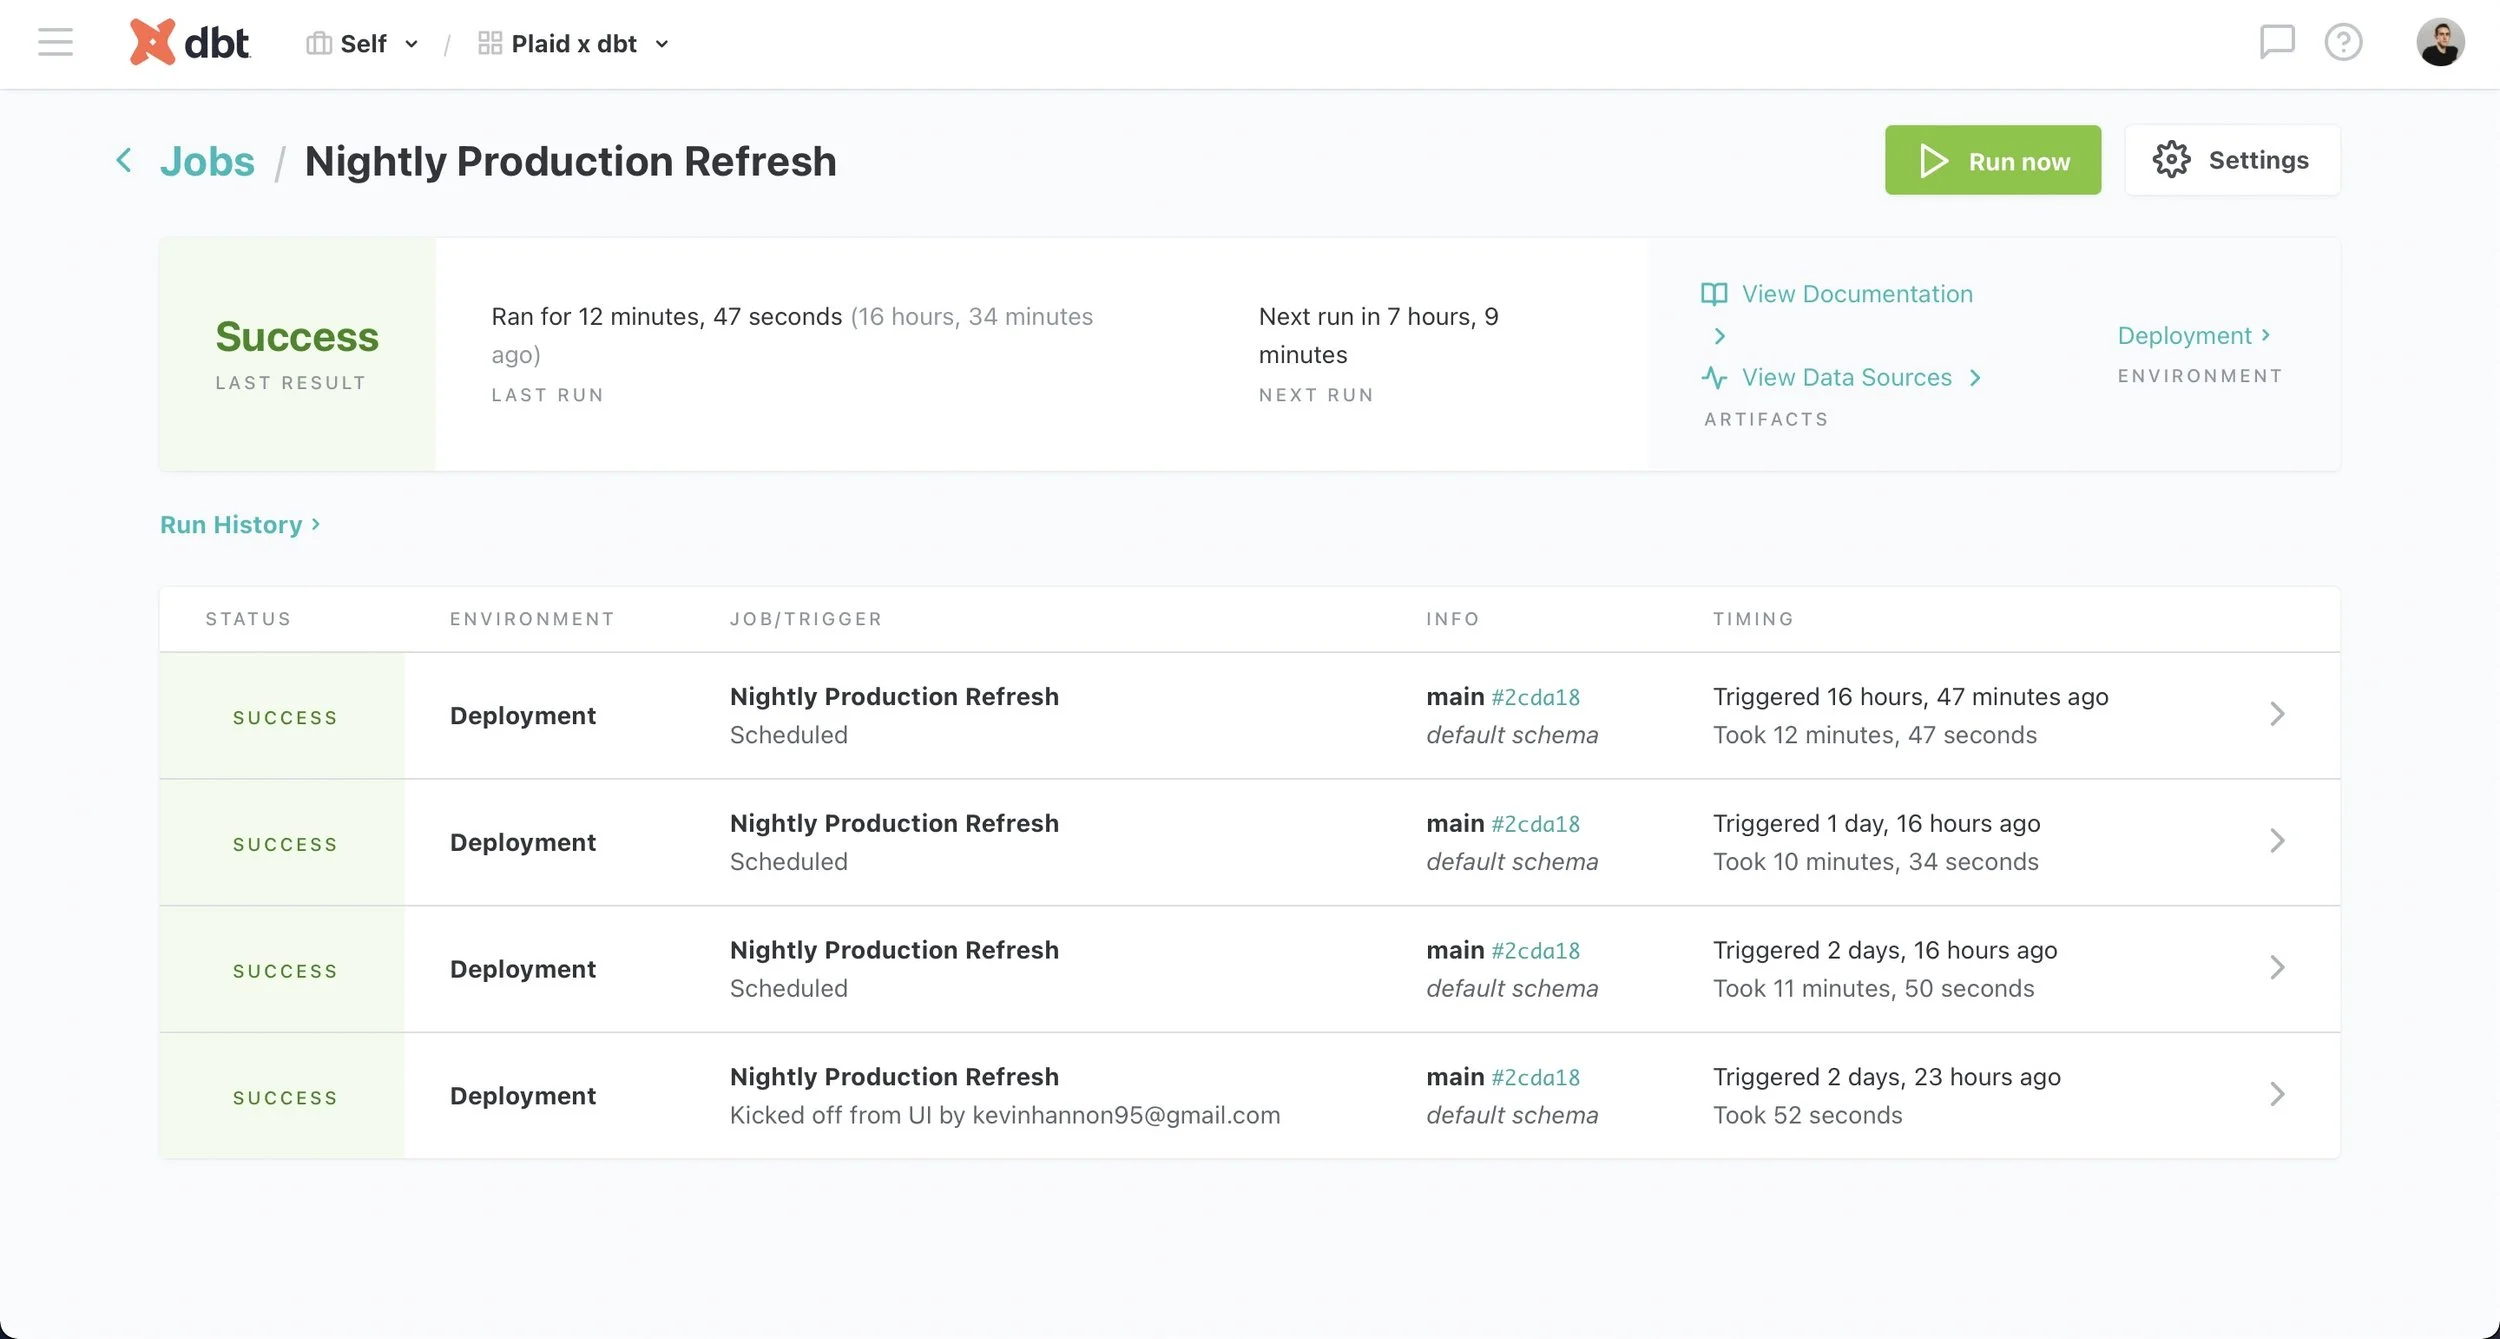
Deployment
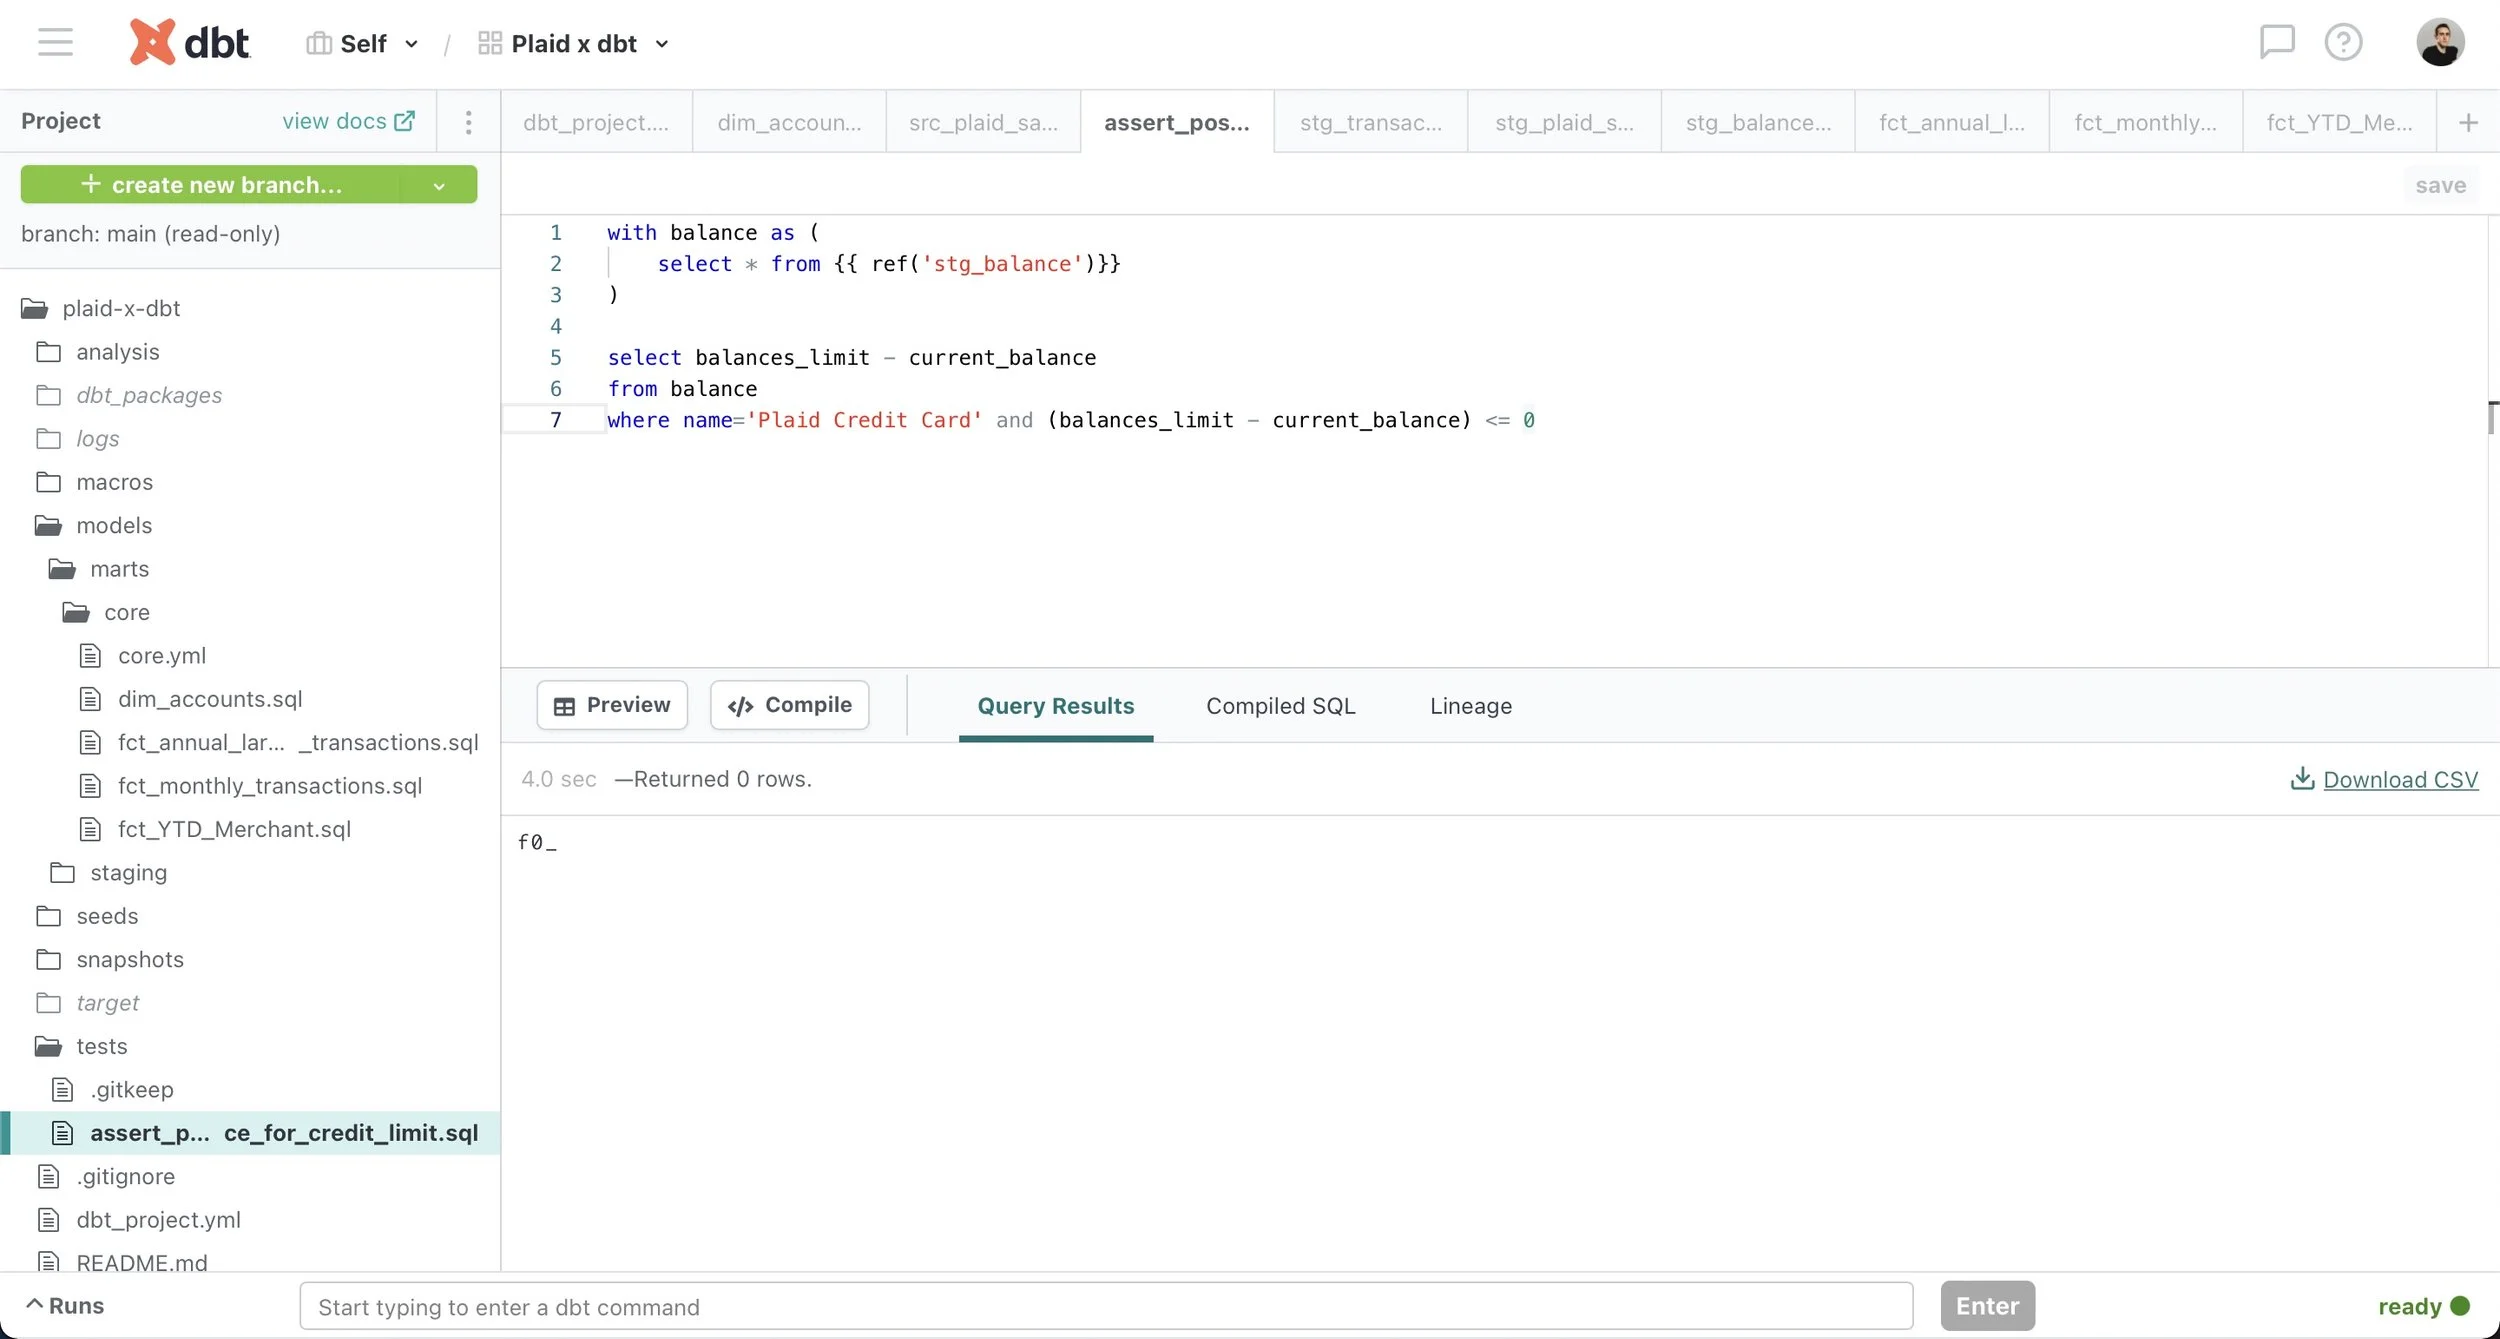
Robust testing functionality in dbt identifies exactly where a problem occurred and can prevent further errors by ensuring that models meet certain assertions about the source data. Generic tests (e.g. accepted_values, not_null) are specified in YML files to run on particular columns in a model while specific tests are written as a SQL query to run against an entire model, as in this example verifying that a credit card balance has not exceeded its limit. These tests automatically check for broken models that may result in problems downstream rather than only learning about it from an analyst when something goes wrong.
Additionally, development and deployment environments allow dbt to run on a schedule in a deployment environment and provide up-to-date model outputs to inform dashboards, reporting and other key business decisions. Meanwhile, analytics engineers can continue working on the dbt project in a separate development environment to fix any potential issues without affecting end users.
dbt empowers data teams through transparent modeling, testing and documentation features that make the analytics data stack accessible to engineers as well as analysts. As a result, dbt improves organizational efficiency because its modularity allows models to be recombined to allow end users to answer their own questions or refer to the automatically-generated dbt documentation site to further examine the datasets. Meanwhile, its robust testing functionality pinpoints potential issues which can then be swiftly resolved in a separate development environment so the organization never misses a beat.